Table of contents
Urban freight is essential to metropolitan economies. However, urban freight emissions are not distributed evenly across transport networks.
Citywide totals can hide important differences between roads and urban areas. Planners need to know where emissions occur and which traffic conditions intensify them. They also need to understand how freight growth or changes in vehicle fleets could affect different locations.
I conducted this research with Emilian Szczepański and Jakub Murawski from Warsaw University of Technology, as part of the E-Laas project. We examined how macroscopic transport modeling with PTV Visum can support this analysis. In this article, I explain how we combined traffic assignment, COPERT factors, and spatial analysis to identify priority links, zones, and scenario effects.
Beyond Traffic Forecasting
Our case study focused on the 41 municipalities of the Upper Silesian-Zagłębie Metropolis, or GZM, in southern Poland. The region comprises 41 cities and municipalities. Its dense road network, industrial activity, and freight demand made it a relevant case.
We started with an existing, calibrated four-step transport model in PTV Visum. The network represented road infrastructure, while the demand model covered passenger and freight movements. We derived freight trip generation and attraction from surveys, spatial data, employment, land use, and business locations.
A reliable base model was essential. Environmental calculations cannot correct inaccurate demand, vehicle categories, network conditions, or route choices. Weak assumptions could therefore produce misleading spatial results.
Using the same calibrated PTV Visum model kept freight flows, network conditions, and scenario assumptions consistent across the analysis.
For each network link, the model provided traffic volumes, vehicle kilometers traveled, road class, capacity, average speed, and volume-to-capacity ratio.
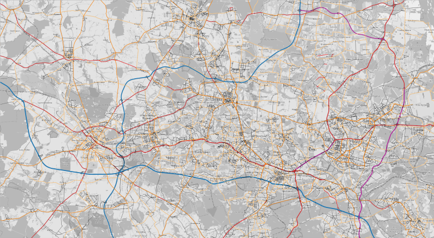
We used these outputs to examine how road type and traffic conditions influenced energy use and emissions.
Adding COPERT Emission Data
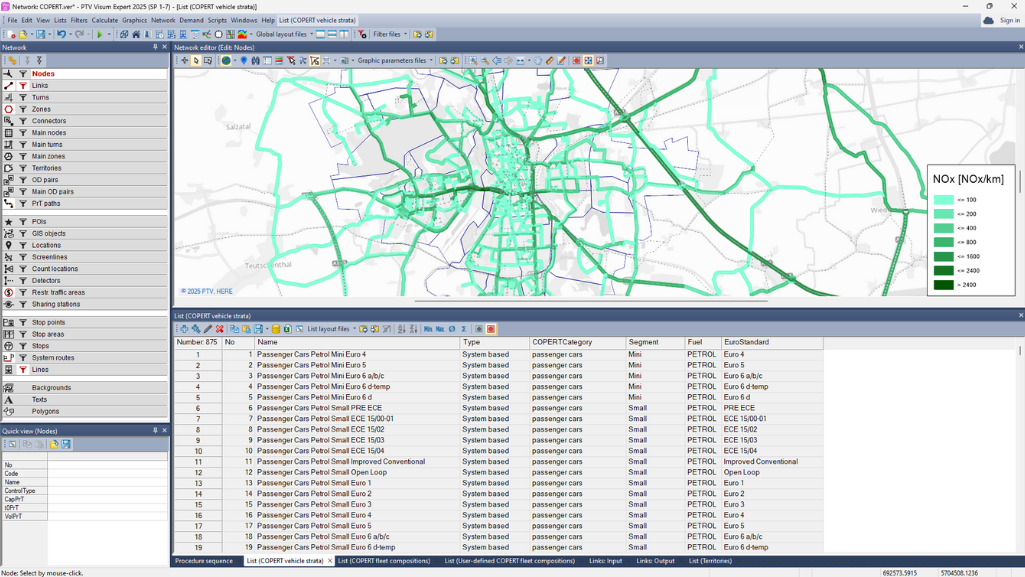
We then connected modeled traffic activity with COPERT emission and energy factors. A technical overview explains the COPERT methodology in PTV Visum.
First, we matched the PTV Visum vehicle classes to corresponding COPERT categories. The 2022 fleet composition distinguished passenger cars, light commercial vehicles, and heavy freight vehicles.
Next, we combined the COPERT factors with traffic volumes and average link speeds from PTV Visum. This allowed us to calculate gasoline and diesel consumption, electric-vehicle energy use, and emissions for several pollutants.
We also estimated external costs for selected pollutants using European reference values.
PTV Visum provided demand, assignment, network conditions, and scenario results. COPERT supplied vehicle-specific energy and emission factors.
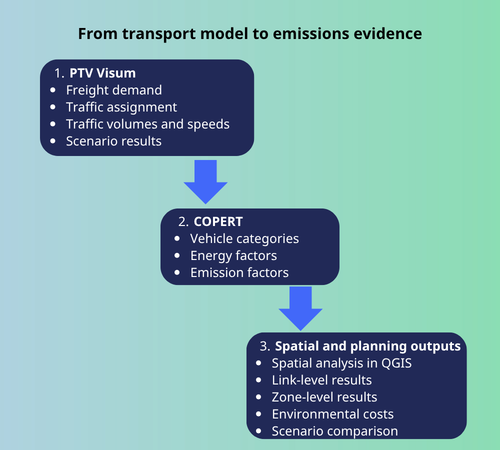
This linked environmental indicators to individual roads instead of one metropolitan average. We could compare road classes and examine how speed and congestion influenced energy use and emissions.
The method estimates emissions from modeled traffic activity. It does not calculate pollutant dispersion, ambient concentrations, or population exposure. Where queues and time-dependent congestion could change the result, planners should also consider when mesoscopic modeling becomes useful.
Mapping Urban Freight Emissions
Link-level results showed where energy use and emissions occurred across the road network. However, planners also need to understand how these patterns relate to urban functions.
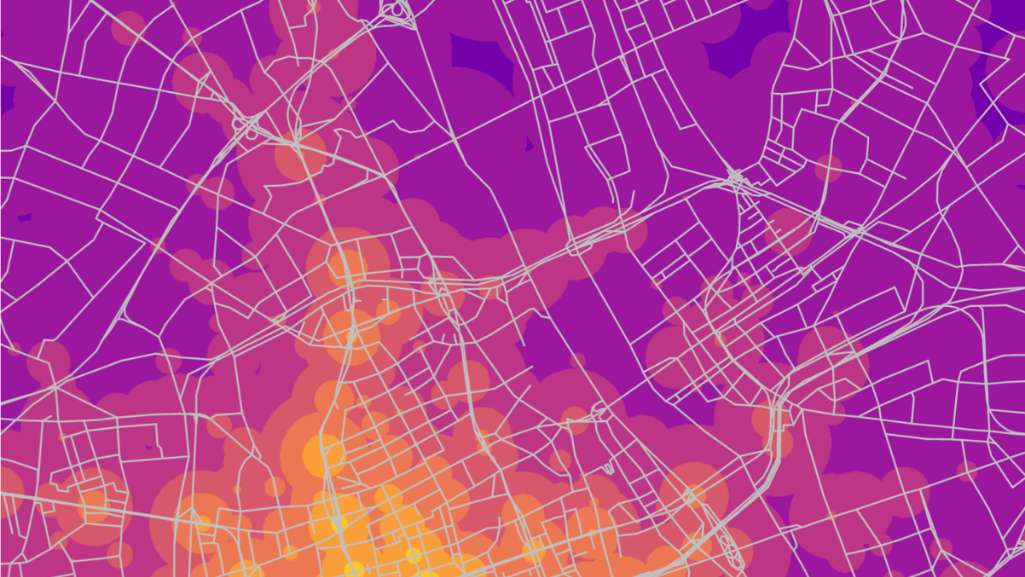
We exported network links, modeled attributes, and Traffic Analysis Zones from PTV Visum for further analysis in QGIS. We then aggregated the results by zone. We compared them with residential, retail, industrial, warehouse, and logistics activities.
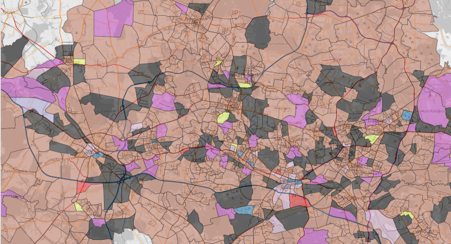
We also developed a transit-rate indicator to separate locally generated activity from through traffic. Without this distinction, a zone crossed by a major corridor could appear environmentally intensive despite generating relatively few trips.
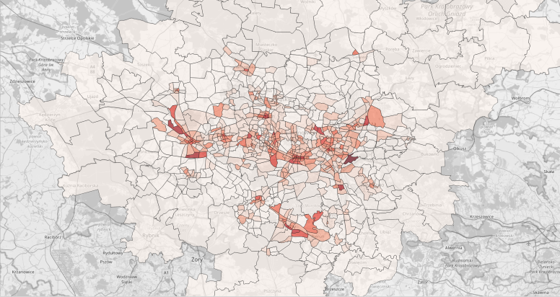
The analysis revealed clear spatial differences. Higher-class roads carried large traffic and freight volumes. In contrast, congested lower-class streets could show high freight-specific impacts because of low speeds and stop-and-go conditions.
The findings demonstrate the limits of citywide averages. Link-level results identify corridors where freight volumes and inefficient conditions coincide. Zone-level results indicate whether local activity or through traffic drives modeled impacts.
Comparing Freight Scenarios
We tested two scenarios against the base case. The first increased freight trip production and attraction by 20% to represent a seasonal peak. We then recalculated demand distribution, traffic assignment, energy use, and emissions.
The second scenario replaced the modeled freight fleet with electric vehicle categories. Traffic demand remained unchanged, allowing us to isolate the effect of fleet composition.
Results varied spatially. During the seasonal peak, freight energy use rose by about 20% to 23% across most road classes. Total traffic energy use rose by about 5% to 10%, reflecting different freight shares across the network.
Full fleet electrification reduced modeled energy use, with the scale of change varying by road class and zone. It also eliminated the calculated freight costs for the selected tailpipe pollutants. These results show why planners should examine where scenario effects occur, not only network-wide totals.
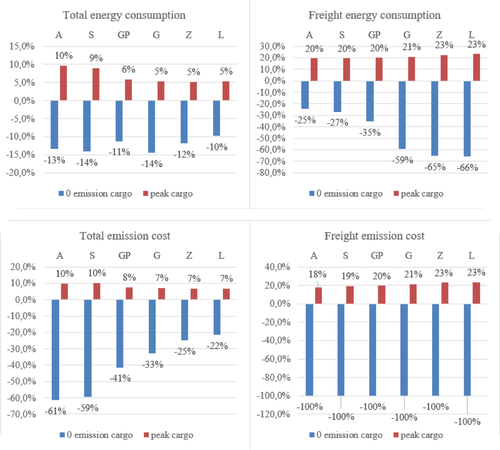
The electrification result requires careful interpretation. The scenario does not represent zero lifecycle impact. It excludes emissions from electricity generation and does not capture every form of non-exhaust pollution. Instead, it shows how fleet electrification changes the indicators included in our modeling framework.
Supporting Planning Decisions
The main lesson is not that one freight policy works everywhere. Instead, an existing strategic model can provide a consistent basis for environmental analysis.
Combined with emission factors and spatial analysis, PTV Visum supports practical planning tasks:
- Link-level results can identify corridors where freight volumes and inefficient operating conditions coincide.
- Zone-level results can indicate whether impacts relate mainly to local activity or through traffic.
- Scenario comparisons can show where changes in freight demand or fleet composition may have the greatest effect.
These insights can inform delivery-time regulations, access restrictions, consolidation strategies, and lower-emission vehicle incentives. A similar scenario-based approach can help cities evaluate access policies before implementation.
However, the model does not prescribe specific measures. Its results should support stakeholder discussions, detailed analysis, and field validation.
The research also informs teaching at Cracow University of Technology. In an emissions simulation course, transportation students use a medium-sized city model developed during a previous semester to assess how transport infrastructure scenarios affect emissions.
Our next steps include comparing COPERT with other emission approaches and validating modeled patterns against field measurements. Macroscopic modeling cannot remove urban freight’s complexity, but it can make it visible, structured, and testable for environmental planning.

From transport models to environmental evidence
Use PTV Visum to compare freight scenarios, identify environmentally sensitive network areas, and strengthen planning decisions