
Table of contents
Fast-growing cities often lack an evidence base for turning mobility ideas into decisions. A digital transport model is the most practical way to develop this type of evidence.
When new districts emerge and travel patterns shift quickly, static maps and isolated counts are no longer sufficient. You need a way to test options, compare trade-offs, and justify decisions in an uncertain environment.
In Tashkent, the capital of Uzbekistan, we addressed this issue by developing a citywide digital transport model using PTV Visum. This was part of the “Development of a Transport Master Plan for Tashkent City” project. This project drew on two perspectives: academic discipline and the practical realities of planning in a rapidly changing city.
The model became operational in late 2025, creating a consistent analytical foundation for both the current network and future scenarios. In this article, I will share the blueprint we used in Tashkent so that you can apply the same steps in your own city or client work. This will help you reduce rework and build a model that stakeholders can trust for master plan decisions.
Step 1: Code the network
The first rule is simple: you cannot forecast what you did not code.
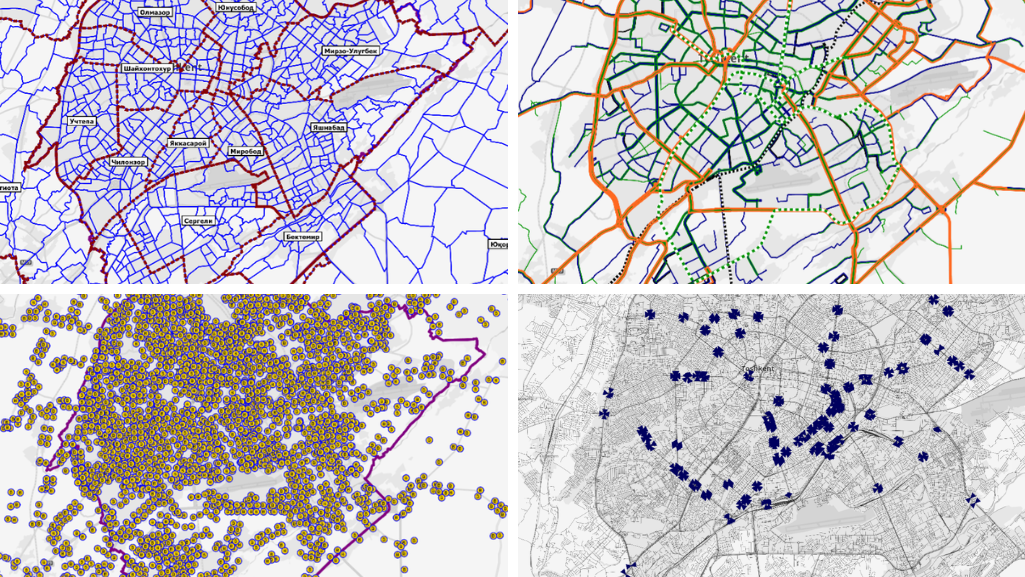
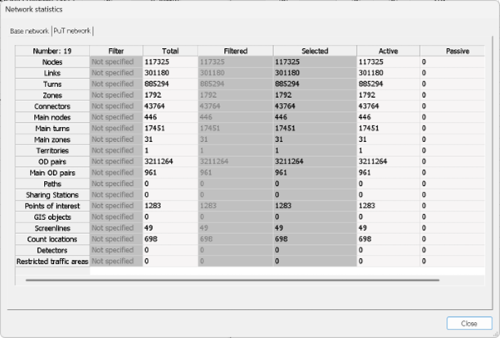
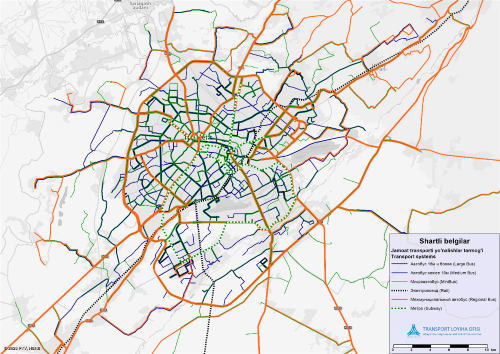
We started by digitizing the road network, not only its geometry but the attributes that actually drive performance. We coded lane configurations, link capacities, restriction rules, and traffic control logic where it mattered. The aim was a network that behaves like the real city, not a simplified drawing.
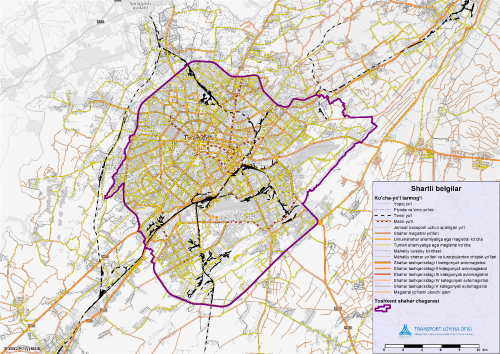
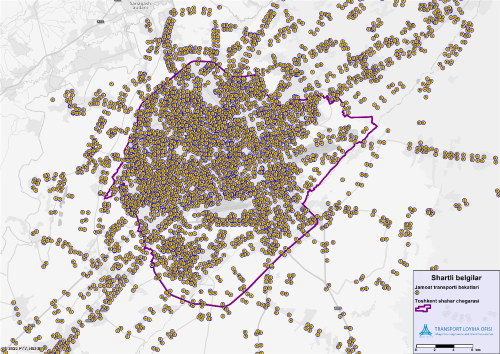
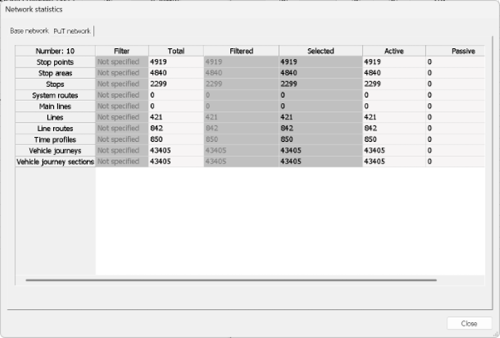
We then digitized public transport routes and stops, along with service schedules and fleet composition. Keeping road and public transport consistent in one modelling environment reduces mismatched assumptions later, especially when you move from “building” to “proving” the model.
PTV Visum supported this workflow well because it helped us keep supply networks, demand inputs, and validation checks aligned as the model evolved, without splitting the logic across separate tools and files.
Step 2: Define zones
Zoning is the spatial language that your demand model will use for years to come.
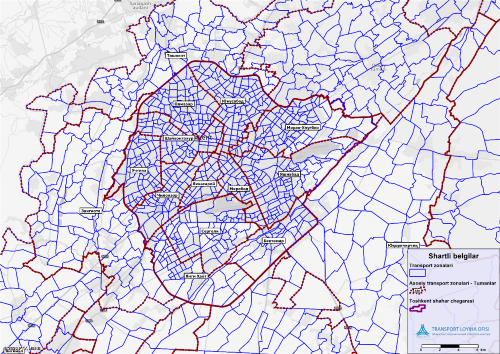
We outlined transport zones across the city and its surrounding area. Then, we linked these zones to socioeconomic inputs, such as population density, employment distribution, land use type, and demographic indicators.
Our goal was to create a zone system that was detailed enough to represent development patterns. Also, we wanted it to be stable enough to remain usable as the city grows and scenarios change.
This zone system formed the foundation for trip generation and distribution. Later, it facilitated the controlled, traceable updating of future-year assumptions.
Step 3: Build the evidence base
A model is only as defensible as the data supporting it. For a fast-growing city, “some data” is rarely sufficient because uncertainty increases as growth accelerates.
We designed a multi-channel data program with two objectives: to realistically represent behavior and to validate the model with independent evidence.
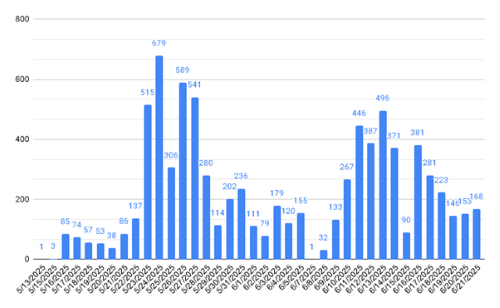
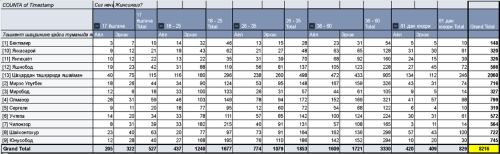
From May 13 to June 21, 2025, we ran social surveys in collaboration with Tashkent State Transport University. We collected responses from over 8,000 participants across administrative districts. These responses provided observed behavior regarding mode preferences, trip purposes, and perceptions of service quality, which we broke down in a way that supports behavioral modeling and spatial representativeness.
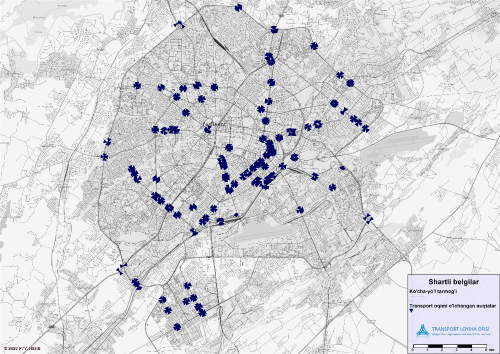
We measured traffic flows at over 150 strategic points across the road network and converted the data into AADT figures. These figures became the basis for validating road assignment outputs and identifying where assumptions needed to be revisited.
Public transport required its own evidence.
We conducted full-scale passenger flow studies on all 164 routes to capture boarding, alighting, and load profiles. We supplemented these studies with public transportation satisfaction surveys that covered waiting times, perceived reliability, and onboard conditions. This approach helped us avoid the common mistake of treating public transport as secondary and then being surprised when the results did not align with the experiences of operators and passengers.
Step 4: Build and validate demand
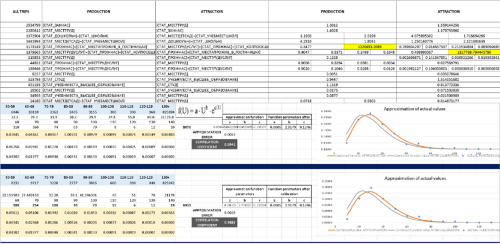
After coding the supply and collecting the evidence, we built a multi-stage demand model within PTV Visum. Our goal was not to invent a novel method, but rather to apply a robust, traceable structure that stakeholders could understand and audit.
We structured the model according to the standard sequence: trip generation by zone, trip distribution between origins and destinations, mode choice based on observed behavior, adjustment of the demand matrix to reflect observed conditions, and assignment to road and public transportation networks.
The validation process determines whether a digital transport model is trusted or debated forever. We calibrated and validated private transportation using traffic count data from over 150 measurement points.
In parallel, we calibrated and validated public transport against passenger flow observations from 164 routes. We checked boardings, alightings, and passenger loads at the route and system levels.
PTV Visum also helped in a subtle yet significant way by supporting consistent iteration across networks, matrices, assignment procedures, and validation comparisons. This ensured that changes remained traceable and explainable. For practitioners, traceability often matters as much as the numerical fit because it determines whether the model influences real decisions.
Step 5: Test scenarios
After we validated the base-year model, its purpose changed. Instead of being primarily a technical deliverable, it became a decision tool.
We developed forecast variants by updating socioeconomic parameters to reflect projected population growth, employment shifts, and land use changes across the planning horizon. Then, we tested interventions by modifying characteristics of the road network, such as expanding capacity, creating new corridors, and upgrading intersections.
Regarding public transportation, we tested alternative service designs, route extensions, and frequency changes. The practical value for planners and consultants lies in the structured environment for comparing alternatives. Rather than relying on intuition, they can quantify trade-offs, identify emerging bottlenecks, and stress-test investments before allocating resources.
Lessons learned
In hindsight, the most useful lessons were not about a single technique, but rather about sequencing and discipline. This allows the model to remain usable long after the initial delivery:
Build for decision-making, not completeness. Be explicit about which master plan choices the model must inform. Then, set network detail, zoning, and survey effort accordingly.
Treat zoning as a long-term commitment because changing zones later can invalidate trend analysis and break comparability.
Design data collection around validation, not convenience. Plan early for independent truth sets for both road traffic and public transportation. This way, discussions will focus on options rather than on whether the model is credible.
Calibrate road and public transportation simultaneously. Validating only road counts leaves transit as the weak link precisely when policy is trying to shift demand.
Keep scenarios comparable by agreeing upfront on how socioeconomic inputs will evolve, how network changes will be coded, and how results will be reported.
Make transparency part of the deliverable. Clear assumptions, versioning, and traceable changes transform a technical model into a planning tool.
Conclusion
Fast-growing cities do not require perfect forecasts. They need a modeling process that is defensible, repeatable, and clear enough to support decision-making in uncertain situations.
In Tashkent, building a digital transport model enabled us to integrate networks, behavior, validation evidence, and scenario testing into a coherent framework.
For urban planners and mobility consultants facing similar growth pressures, this combination often means the difference between “opinions about projects” and “decisions backed by evidence.”

Use transportation modeling for
master plans
See how multimodal models support what-if analysis and scenario planning, before investments are committed
Use transportation modeling for master plans
See how multimodal models support what-if analysis and scenario planning, before investments
Related Posts


