

Table of contents
In many intersection studies, drawing the geometry is not the hard part. The hard part is defensible input data, especially intersection traffic counts that hold up when somebody asks, “How was this number measured?”
In practice, teams often work with partial observations. They might have approach counts but incomplete turning movement counts, or a vehicle mix that is credible at the corridor level but not by movement. They may have queue observations from site visits but no consistent speed profile by stream. Once those gaps exist, assumptions propagate into the model and, later, into the conclusions.
Drone intersection counts can reduce that problem. With a stable overhead view and automated detection, one survey can produce a coherent dataset that covers counts, composition, speeds, and trajectories, aligned in time.
This article describes a practical workflow for drone traffic analysis at intersections and explains how to translate the outputs into PTV Vissim intersection models. We also outline where the method works well, and where it can create false confidence.
The bottleneck
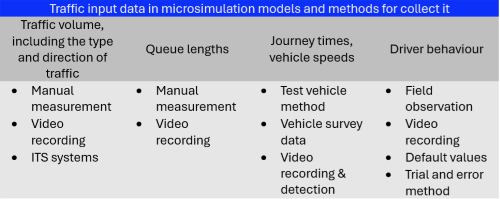
Intersection work relies on inputs that are easy to list but difficult to collect consistently. Demand requires structure, including not only totals, but also turning movements with time slicing that matches the analysis period. Operational evidence must be aligned with the same time window and include queues, delays, and speeds. Behavioral realism often depends on distributions rather than single averages, especially when considering lane utilization and discharge behavior.
Finally, credible movement within the junction requires more than a link diagram. For many sites, effective connectors and lane positioning are driven by observed behavior rather than design intent. If that behavior is misrepresented, the model may match a headline metric but still gets the mechanics wrong.
Traditional methods can provide some of this information, but often, the data is collected separately, with different clocks, fields of view, and levels of detail. Merging them is difficult, and uncertainty tends to hide in the seams.
Drone intersection counts
Drone traffic counts are valuable not because drones make data “accurate” by default. Rather, the value lies in coherence and coverage.
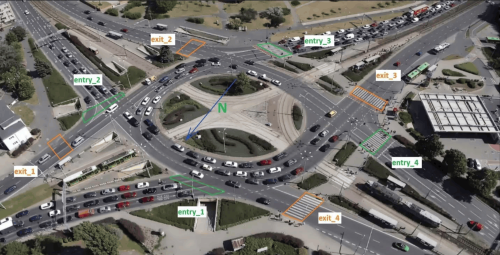
A single overhead recording can provide consistent intersection traffic counts across movements and modes. You can derive counts and classifications from the same population observed, rather than combining a manual count with a separate classification survey. You can also estimate speeds from the same tracked objects rather than combining spot speeds from one location with travel-time runs from another.
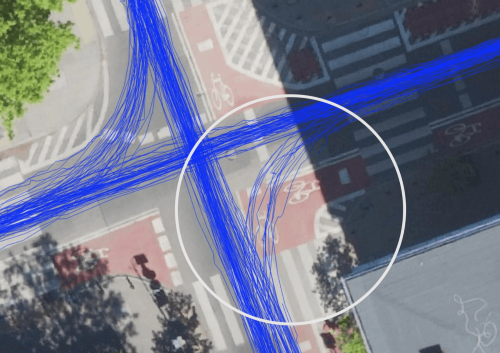
Where conditions allow stable tracking, vehicle trajectories from drone video provide additional information. You can observe how vehicles negotiate turns, their lateral positioning, their use of short auxiliary lanes, and where merging and diverging behavior actually occurs.
For modeling purposes, these details often matter more than a perfectly drawn curb line.
Workflow
The workflow is simple in concept, but it depends on disciplined execution.
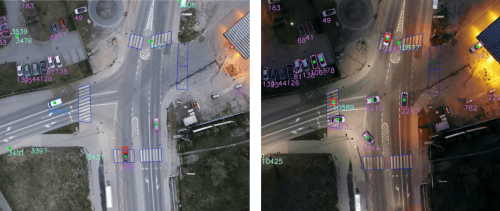
First, capture a stable, top-down view with a usable resolution that covers the approaches and conflict area. The goal is to minimize occlusion and perspective distortion because both reduce track quality and, consequently, the quality of any trajectory-based outputs.
Next, run automated detection and tracking to identify and classify road users and maintain their identities over time. Quality control is important here. Classification performance can vary based on lighting, camera angle, congestion state, and the local vehicle fleet. Tracking stability typically degrades when the scene includes frequent occlusion and close platooning.
Finally, post-process the outputs using the following clear rule: trust the counts first and only trust the trajectories when the tracking supports them. In other words, you can often produce reliable counts even when trajectories are too noisy for distribution fitting. This distinction is important for avoiding the overconfident use of trajectory-derived metrics.
Outputs
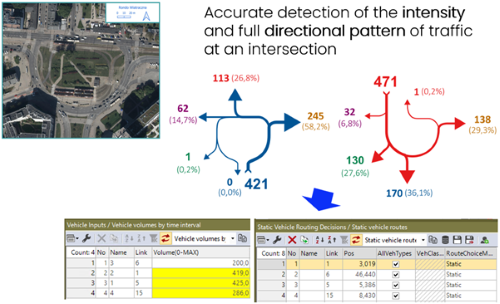
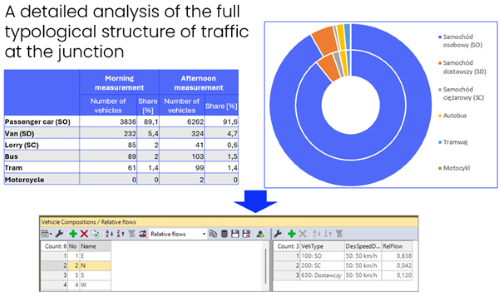
In practice, the dataset supports demand inputs. Turning movement counts can be produced with a complete directional structure and time slicing aligned with simulation periods. Vehicle composition can be derived from movement, which often distinguishes a model that behaves plausibly from one that over- or undersaturates specific lanes.
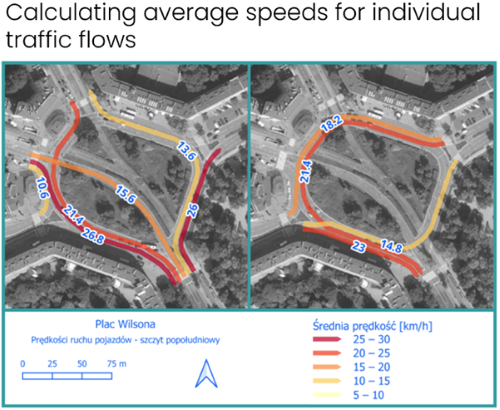
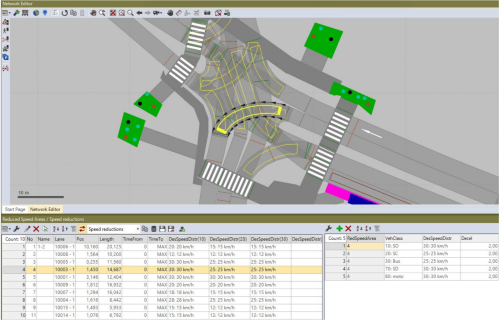
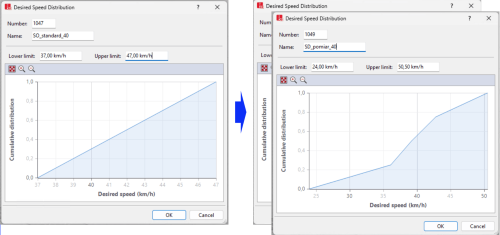
Where tracking quality is sufficient, speeds and speed distributions can be extracted by stream. This is helpful when realistic approach speed profiles, credible discharge behavior, or speed adaptation in restricted zones are needed. It also reduces reliance on default assumptions when speed choice is a sensitive issue.
From counts to trajectories
Vehicle trajectories from drone video can inform network coding decisions.
Real turning paths can reveal whether connectors are too tight, too wide, or misplaced relative to the observed lateral positioning of vehicles. These trajectories can also highlight behaviors that are easy to miss in conventional data, such as late lane changes near the stop line, informal bypass movements, or turning radii that differ significantly from design assumptions.
However, this evidence does not replace engineering judgment. Instead, it improves the transparency of judgment because the data makes it harder to justify choices that contradict observed behavior. These drone intersection counts form the evidence base for demand definition, speed profiles, and network coding in PTV Vissim.
Use cases
Most teams first adopt this approach for operational questions: intersection redesign options, lane allocation changes, signal timing comparisons, and performance reporting, as stakeholders expect traceable inputs for these.
While safety analysis is a valid additional use case, it should be treated as a separate layer with its own quality thresholds. Trajectory-based safety indicators can be informative, but only if the tracking stability, sampling frequency, and occlusion handling are sufficient for the specific safety question at hand. Otherwise, precise-looking outputs can hide uncertainty rather than reduce it.
Limits
Drone-based methods are most effective in short, targeted campaigns, such as peak-hour studies, operational diagnoses, and before-and-after comparisons, when a detailed snapshot is needed rather than continuous coverage.
However, they are less effective when uninterrupted monitoring is the primary requirement, when overhead visibility is obstructed by trees or structures, or when the area is too large to be captured at a workable resolution in a single frame. Practical constraints, such as flight time and battery changes, create recording discontinuities that must be planned around.
A useful rule is to treat trajectories as optional. If site conditions prevent stable observation, be prepared to revert to count-first outputs and treat trajectory-level outputs as enhancements rather than guarantees.
Conclusion
Drone intersection counts are a practical way to strengthen intersection traffic counts and reduce the number of assumptions that creep into intersection studies.
With one overhead survey and automated detection, turning movement counts, vehicle mix, speeds, and vehicle trajectories can be derived from drone video, where conditions support it. These outputs can be easily translated into PTV Vissim intersection models, improving the credibility of the inputs and the transparency of the decisions.
However, the method is not universal. When used in the right context, however, it is an efficient way to transition from “we think this is happening” to “we observed this, and here is how it drives the model.”
If you are interested in this method of data collection and processing, we invite you to visit our website zdgtor.pl.

Strengthen your intersection analysis
The traffic simulation tools helping you model junctions and test scenarios
Strengthen your intersection analysis
The traffic simulation tools helping you model junctions and test scenarios
Related Posts


