


Table of contents
We are a team of mobility engineers at Motiva, a Brazilian infrastructure concession company operating in highways, urban mobility, and airports. Our recent challenge involved evaluating speed-limit changes on Rodovia dos Bandeirantes (SP-348), a major highway in the state of São Paulo that carries approximately 180,000 vehicles per day. As part of this work, we conducted a Highway speed limit simulation.
Instead of relying on intuition or assumptions, we used PTV Vissim to simulate different speed scenarios and evaluate their effects on travel time, traffic flow, and emissions. This experience reinforced a simple lesson: to evaluate changes to the speed limit on highways, simulate them.
What we simulated – and why
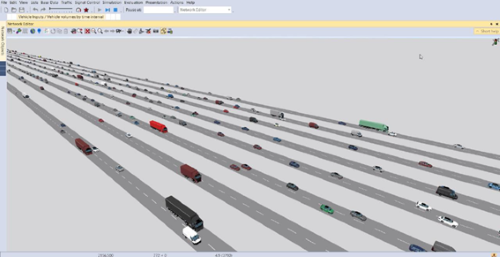
To study operational, environmental, and performance impacts, we built a microscopic model in PTV Vissim with:
- 6 km freeway representation, two lanes, based on actual corridor rules
- Six speed scenarios: 70, 80, 85, 90, 100, 120 km/h
- Eight demand levels representing low to peak-hour flows
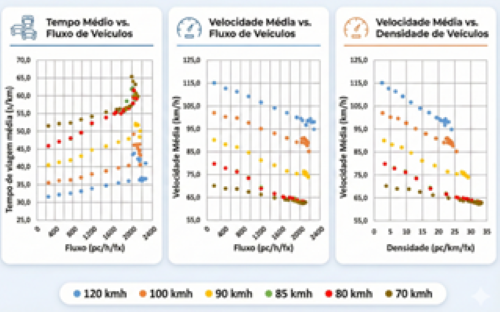
- Traffic metrics: flow, speed, density, travel time
- Emission metrics: CO, NOx, VOC, and fuel consumption via Vissim’s Nodes Evaluation
Starting with simulation allowed us to examine controlled scenarios long before exposing drivers, field teams, or operations to real‑world tests.
Validating the software: real‑world highway testing
Based on the findings from the exploratory assessment of speed variations, we developed a model that accurately reflects real‑world speed and volume conditions, with the goal of applying it in highway testing. The model could only be calibrated after completing the exploratory analyses, ensuring higher accuracy and closer alignment with observed conditions.
The highway test took place on May 16, 2025, with three drivers operating identical gasoline‑powered vehicles along a 40 km stretch (from km 28 to km 68). Each vehicle was assigned a different target speed – 80, 100, and 120 km/h – which the drivers aimed to maintain as consistently as possible.
Because real‑world highway conditions naturally prevent a perfectly constant speed – due to traffic dynamics and environmental factors – the experiment was designed so that each driver would adhere as closely as possible to the predefined speed throughout the entire route.
What Vissim got right
Here are the findings of the comparisons we did between the Vissim model and the real-life highway test:
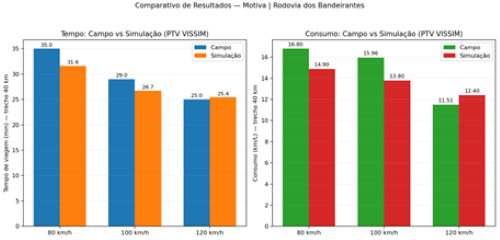
Travel time comparison (40 km)
- 80 km/h: Field 35 min | Vissim 31.6 min
- 100 km/h: Field 29 min | Vissim 26.7 min
- 120 km/h: Field 25 min | Vissim 25.4 min
Average percentage error: ~6.4% – with the largest deviation at 80 km/h, where traffic interactions make constant speeds unrealistic.
Counterintuitive outcomes revealed by simulation
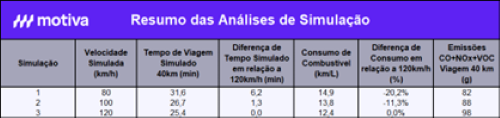
- 120 km/h: fastest, but worst in emissions and fuel.
- 80-100 km/h: slower, but with meaningful environmental benefits and smaller-than-expected time penalties.
Emissions reduction relative to 120 km/h (simulation):
- -16.3% at 80 km/h
- -10.2% at 100 km/h
The takeaway: intuition alone doesn’t capture the real trade-offs. Vissim speed simulation made the relationships visible – and measurable.
Why this matters to traffic engineers
For traffic engineers, this study reinforces a familiar truth: real networks often contradict theoretical expectations. The value here is not tied to one Brazilian corridor – it lies in the approach.
Vissim allowed us to explore how speed-flow-emissions relationships change under varying demands, driver behaviors, and operational conditions. It revealed dynamics that neither field measurements nor intuition alone could uncover.
Simulation turns opinion-driven decisions into evidence-based engineering.‑based engineering.
Lessons for mobility planners
While this Vissim speed simulation took place in Brazil, the principles behind it apply to highways worldwide. Any corridor with fluctuating demand, complex driver behavior, or operational‑safety tensions can benefit from simulating speed scenarios before applying them in the field.
Technical lessons (what to do)
- Simulate before fieldwork. Use Vissim to screen speed scenarios line by line, then validate selectively.
- Expect non‑constant behavior at lower speeds. Divergence at 80 km/h showed why perfect alignment between simulation and field is unrealistic – and unnecessary.
- Include emissions early. Environmental impacts shifted more than travel times did.
- Test across multiple demand levels. Benefits (or penalties) often flipped depending on volume.
- Validate for credibility, not perfection. The ~6.4% travel‑time error was small enough to support decisions confidently.
- Overall analysis of the results: The observed differences in travel time were minimal. Fuel consumption improved at lower speeds. Emissions also decreased under these conditions. These findings show that reducing speeds on some highway segments can improve sustainability. Such speed reductions do not negatively affect the user experience.
Governance lessons (how to gain support)
- Use simulation to align multidisciplinary expectations. It provides neutral ground for operations, safety, and planning teams.
- Share counterintuitive results. They create trust and encourage data‑driven decisions.
- Communicate using clear visual comparisons. Tables and scenario contrasts help non‑technical stakeholders follow along.
- Be transparent about assumptions. It strengthens – not weakens – your recommendations.
Limitations of highway speed limit simulation
Every simulation study has boundaries. Acknowledging them makes the conclusions more credible. Here are the key limitations to consider when interpreting our results:
- Field drivers can’t maintain constant speeds; comparisons are directional, not exact.
- The 6 km corridor abstraction simplifies certain dynamics of the full Bandeirantes Highway.
- Emission estimates rely on model assumptions; treat them as comparative, not absolute.
- Only gasoline vehicles were tested; different fleets may perform differently.
- Some figures above contain modeled outputs, not direct measurements.
Should you simulate before field testing?
Yes – and this project demonstrated why. Vissim speed simulation allowed us to test controlled scenarios, uncover hidden relationships, and validate with real-world data at credible accuracy.
If you’re considering speed‑limit changes, begin with simulation. It will show you what intuition can’t.

Explore Traffic Simulation
Analyze real‑world conditions, test operational scenarios, and make data‑driven mobility decisions
with PTV technology
Explore Traffic Simulation
Analyze real‑world conditions, test operational scenarios, and make data‑driven mobility decisions with PTV technology
Related Posts


