

Table of contents
At URBTEC, a Brazil-based urban mobility consultancy, we approached this PTV Visum bus network redesign with a simple premise: build the future in the model first, then change services on the street.
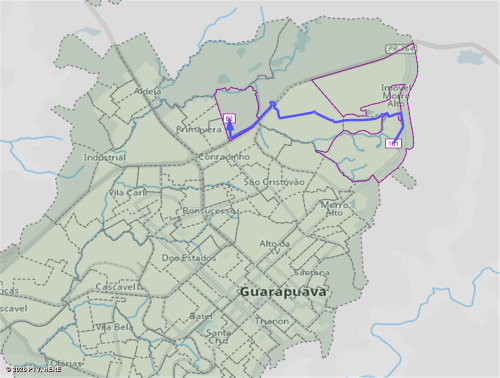
Guarapuava, a midsized city in Brazil, became our test bed.
Using timetable-based assignments in Visum allowed us to simulate actual departures, real transfer waits, and journey-level choices. This enabled us to test, compare, and defend every proposal before changing a single bus line. In this article, we will explain our process and share lessons that can be applied to other transit systems.
Context
Guarapuava, a city in southern Brazil, has a population of about 182,000 (as of 2022) and is a regional hub for education, health, and industry. However, its bus network has not undergone a complete restructuring in years.
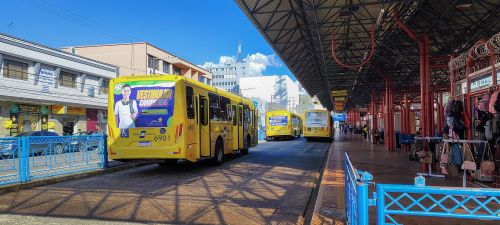
Our baseline showed around 437,000 passengers per month (or about 20,000 per day), with the sharpest peak between 6:00 and 7:00 a.m. Nearly all services funneled into Terminal da Fonte, a facility designed for 12 buses, but which we observed with up to 39 buses at once.
Of the 848 stops across 11 typologies, 287 had no signage. A user survey of 2,425 respondents corroborated the pinch points. Sixty-one percent rated the stop infrastructure as poor or very poor, 48% cited overcrowding, and 70% were dissatisfied with the fares.
In July 2024, the municipality commissioned us to develop the Urban Transit Plan (PTU), for which the PTV Visum model became the analytical core.
Model
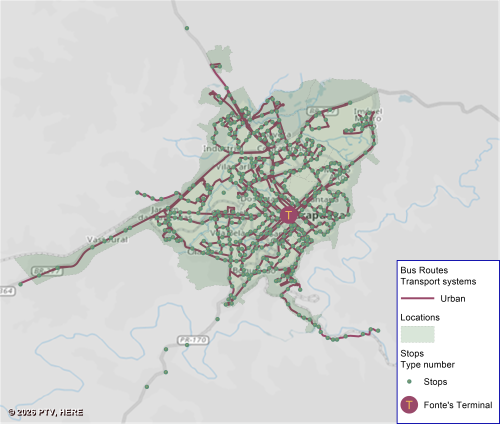
We created a timetable using a macrosimulation in PTV Visum that covers the entire system: Thirty-nine urban lines, plus district services to Entre Rios and Palmeirinha.
The demand came from fieldwork conducted in October 2024. This fieldwork included on-board origin-destination (O–D) surveys, boarding/alighting counts, and user interviews.
The fieldwork yielded 15 calibrated OD matrices: nine for the urban network (three time periods × three user types: full fare, students, and free pass) and six for district services. We modeled the urban and district services together because the proposed system targets unified ticketing and operations.
For a redesign centered on integration, timetable-based assignment was nonnegotiable. We used Visum’s timetable-based assignment, the most detailed of its three public transportation allocation procedures, to coordinate actual runs and compute real transfer waits. This enabled journey-level route choice.
We calibrated impedance parameters adapted from Greater Curitiba and deliberately increased the transfer penalty to reflect observed behavior; riders rarely transferred in the base system. We validated the model by comparing the predicted loads to the field counts at 28 urban and eight district observation sections, using GEH as the primary acceptance criterion. Nearly all of the matrices met international standards.
Insights
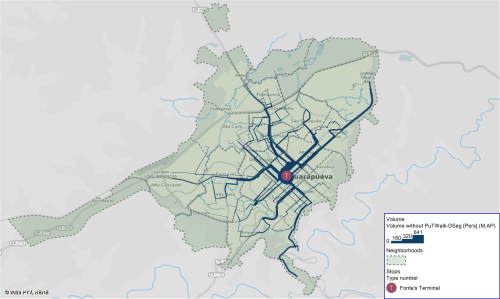
The model made demand patterns legible.
During the morning peak, flows radiate from neighborhoods such as Boqueirão toward the center. In the afternoon, the pattern reverses. At midday, educational trips dominate, and Santa Cruz and Cascavel (home to Unicentro and Campo Real) emerge as key attractors.
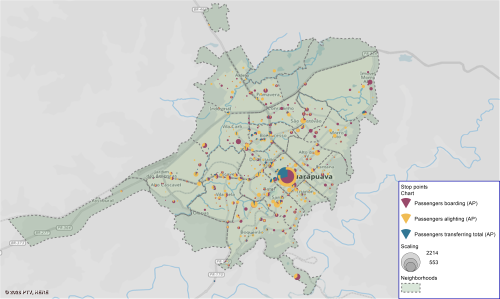
Importantly, stop-level board/alight/transfer outputs revealed that the city’s activity was not confined to downtown; secondary hubs emerged in Boqueirão, Cascavel, Cidade dos Lagos, and Morro Alto. Those maps didn’t just describe problems; they also indicated where to build integration infrastructure.
Design
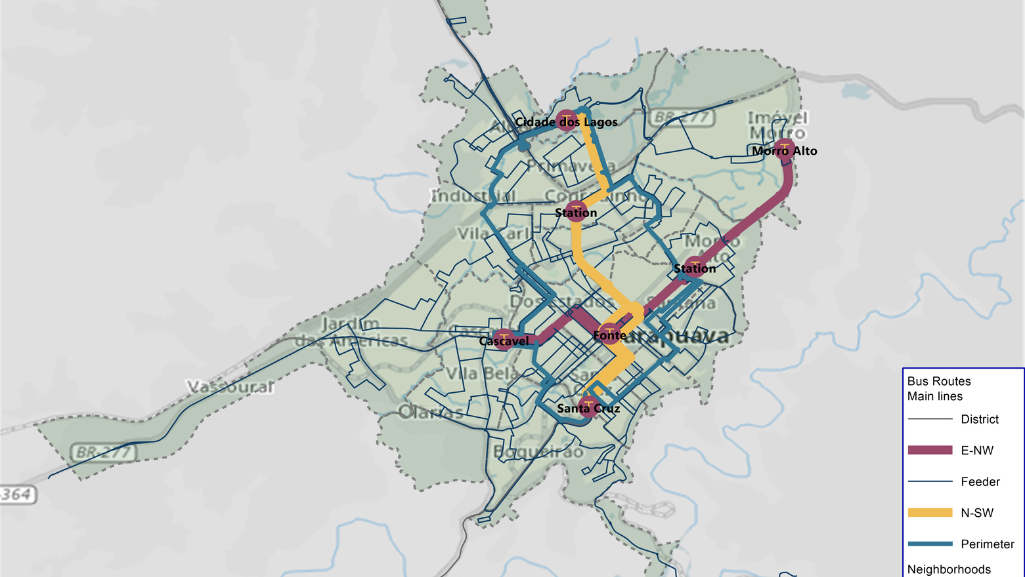
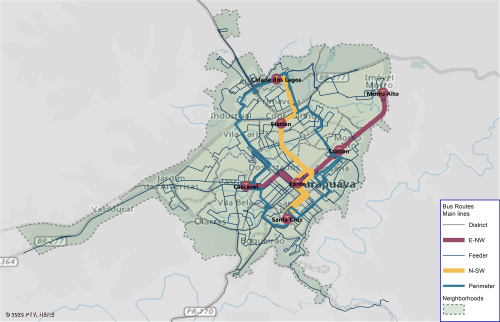
Guided by this evidence, we proposed a trunk and feeder structure with six new integration terminals – seven nodes in total – located where demand naturally occurs.
The redesigned network consists of 45 lines (an increase from 39); seven integration points (an increase from one); and approximately 281,000 vehicle kilometers per month (an increase from approximately 187,000 km); with a modest increase in the fleet size: 54 vs. 49 peak buses.
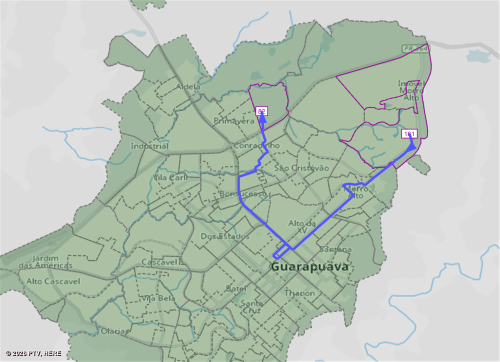
We also introduced a circular line that connects terminals without passing through downtown, thereby removing a structural inefficiency that the model exposed.
The stop level board/alight/transfer outputs made terminal siting evidence-based, not heuristic.
OD impacts: PTV Visum bus network redesign
We emphasize OD pairs, not abstractions, so peers can see rider‑level effects. These are modeled outputs:
- Cidade dos Lagos → Alto Cascavel: 72 → 45 min (−37%), enabled by a path that bypasses the center.
- Distrito Industrial → Santa Cruz: 57 → 34 min (−39%), with transfers at the new Cascavel and Santa Cruz terminals.
- Boqueirão → Jardim das Américas: 52 → 33 min (−36%), again avoiding the center.
- Cidade dos Lagos → Imóveis Morro Alto: 64 → 22 min (−65%), previously no direct connection.
Beyond speed, the core value is predictability. Because the assignment is timetable-based, transfer wait times and schedule coordination are modeled explicitly. This is what transforms “shorter” into “reliably shorter.”
What’s done
We delivered a validated digital twin of Guarapuava’s public transportation network. Consisting of 6,212 nodes and 19,214 links, it also includes 15 calibrated OD matrices that meet GEH acceptance thresholds across observation sections.
The framework standardizes like-for-like comparisons with identical demand and consistent parameters. This makes trade-offs, including those related to fleet size, layover times, terminal size, and route selection, transparent and reproducible. It provides a defensible basis for concession planning and a common reference for communicating with the public.
Lessons for planners
- Calibrate for reality first. If base riders avoid transfers, reflect that by implementing a higher transfer penalty before testing integration. This protects the credibility of projected gains.
- Map what matters. Stop, level, board, alight, and transfer outputs justify terminal locations better than prose ever will.
- Keep apples to apples. Fix demand and parameters across scenarios. Use a timetable-based assignment so that schedule coordination and real transfer waits are considered.
If you’re planning a PTV Visum bus network redesign, a calibrated, timetable-based model doesn’t just support the plan – it shapes it.

Transform your public transport planning
The digital tools to optimize routing, adapt fares,
and meet demand
Transform your public transport planning
The digital tools to optimize routing, adapt fares, and meet demand


