
Table of contents
When I first examined the evacuation plan for this university building, I wondered if making small, realistic changes would allow for a faster and safer evacuation. In this article, I will walk you through a building evacuation simulation that I developed using PTV Viswalk software. I will show you the evidence that the simulation produced and explain how you can reuse it in your own projects.
What you’ll learn:
• How to set up credible agent-based scenario families (occupancy x speed x architecture).
• How to distinguish apparent from actual bottlenecks using measured capacities and room-level KPIs.
• How to present results with clear metrics and visuals that facilitate decision-making.
Although I use one real building as an example, the method and lessons apply globally.
Context
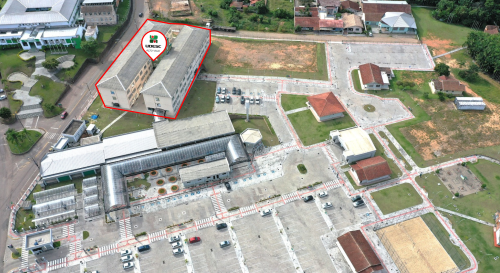
The subject is a three-story academic building at a campus of the Santa Catarina State University (UDESC) in Ibirama, southern Brazil. The building has classrooms, labs, and offices. The current occupancy is about 508, with a maximum of 1,635 people allowed for educational use. Since crowd dynamics are emerging, I used an agent-based approach in PTV Viswalk (within PTV Vissim) to ensure that the outcomes would reflect realistic interactions and scale as occupancy increases.
Methods & tools
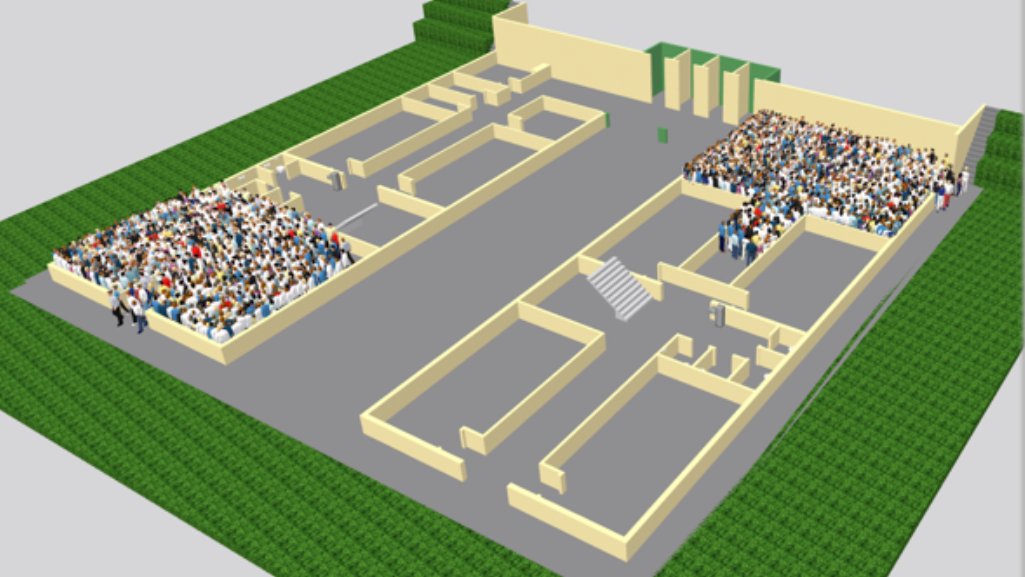
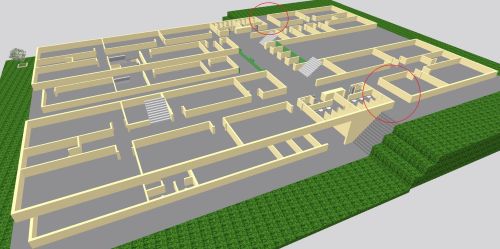
Using PTV Viswalk within PTV Vissim, I built a high-fidelity 3D digital twin to simulate agent-based pedestrian dynamics with realistic interactions, manage scenarios, and export KPIs and animations.
I varied occupancy (304-1,635 people), walking speed (normal: 1.20 m/s; fast: 1.53 m/s; and panic: 3.33 m/s), and architecture (baseline vs. a modified layout with two new ground-floor exits) across 84 scenarios.
To reflect observed behavior, I applied a 50% speed reduction on stairs for vertical movement. For capacity modeling, I used clear (usable) door widths rather than nominal sizes since frames and hardware reduce the effective width at peak.
The population represented a typical evening mix, with entries, routes, and destinations calibrated to actual usage of the building.
The artifacts produced included a high-fidelity 3D model, density maps, time series, exit use distributions, and room-level time-to-exit metrics across all 84 scenarios, as well as exportable animations for communicating with stakeholders.
Building Evacuation Simulation – what changed and why
Baseline diagnosis
Two stairways connecting the ground floor to the sub-basement forced most occupants to converge before reaching the outside. The exit doors weren’t the issue; the stairs were.
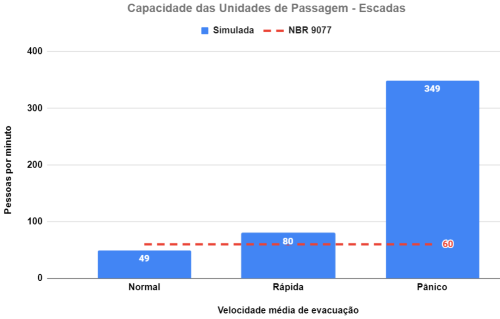
Measured throughputs:
Stairs: ~49 people per minute (normal walking) and ~80 people per minute (fast walking).
Doors: comfortably above 100 people per minute in all walking speeds.
These measurements confirmed that resizing the doors alone wouldn’t help because queues formed at the stairs.
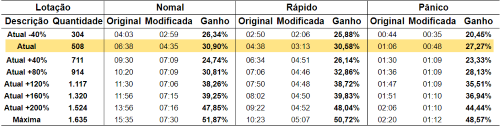
Evacuation times at 508 occupants: 6:38 (normal) and 4:38 (fast).
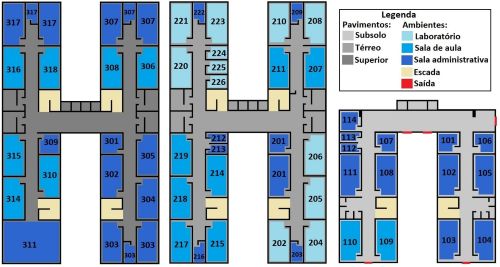
Room level disparities: Some rooms on upper floors – e.g., 310, 314, and 315 – had higher average exit times than similar rooms because they fed the busier stair pair. A design can “work on average” while causing significant delays in specific locations.
Intervention
I tested a focused architectural change: adding two direct outside exits on the ground floor. This creates shorter alternative routes for occupants on the ground and upper floors that bypass the constrained ground-to-sub-basement link, thus redistributing demand away from the overloaded stair pair.
I kept everything else – occupancy, speeds, and behavior – constant for a clean, like-for-like comparison.
Impact
• At 508 occupants, the total evacuation time decreased by ~27%.
• At 1,635 occupants (the maximum), the time fell by ~51.9%.
• Beyond code limits (stress tests): With the number of occupants increased to 2,640, the time savings remained at ~47–50% across speed settings, which is still substantial under adverse conditions.
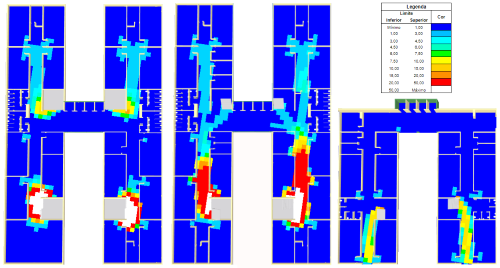
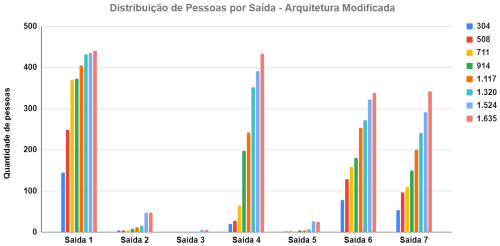
The visuals showed that: Density heat maps shifted from red bands at the original stair cores to a smoother, more even flow across four outbound options. Corridor queues thinned, and the distribution of exit use confirmed load rebalancing (many evacuees moved from previously overloaded exits to the two new ground-floor doors).
Why it works
Evacuation is a network flow problem that includes human behavior. When vertical elements are scarce, they sit on many of the shortest paths and dominate system performance.
Adding well-placed ground-floor exits accomplishes three things: it eliminates unnecessary vertical movement for many occupants, shortens path lengths, and reduces exposure to conflict zones. It also breaks up lines at stairwell entrances, unlocking the building’s existing capacity.
Since door throughputs were already high, diverting demand away from the stairs produced significant benefits without the need for complex work. These results confirm that building evacuation simulation reveals vertical constraints that average metrics can hide.
Lessons & takeaways
Why this matters: A common pattern emerged across 84 scenarios: in multistory buildings, vertical elements (stairs and ramps) usually determine performance, while doors often have latent capacity. The guidance below generalizes beyond any single code base or building type.
Reusable workflow (code-agnostic): Accurately model geometry and clear widths, choose realistic speed distributions, include a stair penalty, run scenario families (today, future, stress), and report building-wide and room-level KPIs. Wherever you practice, map these steps to your local life-safety framework (e.g., occupant-load factors, people-per-minute flow, travel-distance limits). Only the numeric thresholds change.
What to do first (and why):
Target vertical constraints. If multiple floors feed through a few stairs, resizing the doors won’t fix the system. Direct-to-outside options often will by removing unnecessary vertical movement and breaking up the lines at the stairwell entrances.
Model what’s usable. Apply clear widths and realistic stair penalties to avoid overestimating capacity.
Look beyond averages. Room-level time-to-exit reveals who is over-delayed and why, exposing inequities masked by building-wide metrics.
Plan for growth. At ~500 occupants, times may appear acceptable, but near 1,000+, they become risky. Design with scenario families from day one.
Communicate visually. Density maps, exit-use charts, and short animations make trade-offs obvious to non-experts and accelerate decision-making.
Limitations
To mirror typical evening conditions, room headcounts were based on schedules and day-to-day familiarity rather than a formal survey. This approximation did not change the location of the bottlenecks (stairs versus doors) or the benefits of adding two new ground-floor exits. However, this method can easily be improved with a quick occupancy audit or sensor-based counts, and it is worth noting for future studies.
What’s next
I’m applying the same approach – PTV Viswalk with PTV Vissim – to entrances, forecourts, and parking areas to perform stress tests on peak arrival and departure times.
Once the performance, through building evacuation simulation, is visible and measurable, better designs will follow, often with minor changes.

Plan safer buildings with PTV Viswalk
Simulate pedestrian flows, test egress options,
and communicate results
with evidence.
Plan safer buildings with PTV Viswalk
Simulate pedestrian flows, test egress options, and communicate results with evidence.


