

Table of contents
Rail station crowd simulation is often less about proving that crowding exists. It is about evidence, priority, timing, and ensuring passenger safety.
In this study, we used rail station crowd simulation in PTV Viswalk to convert observed passenger counts into platform density and Level of Service (LOS). We then ran a stress test for a 10‑year demand increase to identify where today’s “acceptable” conditions become an operational risk.
Why this matters: Platform crowding decisions are often based on static checks or peak averages. This approach shows how density, LOS, and risk change over time and across specific platform areas, using data planners already collect.
This article is written for planners and engineers who need a repeatable workflow.
Note: The article is based on The Analysis of Passenger Facilities Level of Service on the Jakarta–Bogor Commuter Line’s Stations Using PTV Viswalk, conducted by the authors.
Case study
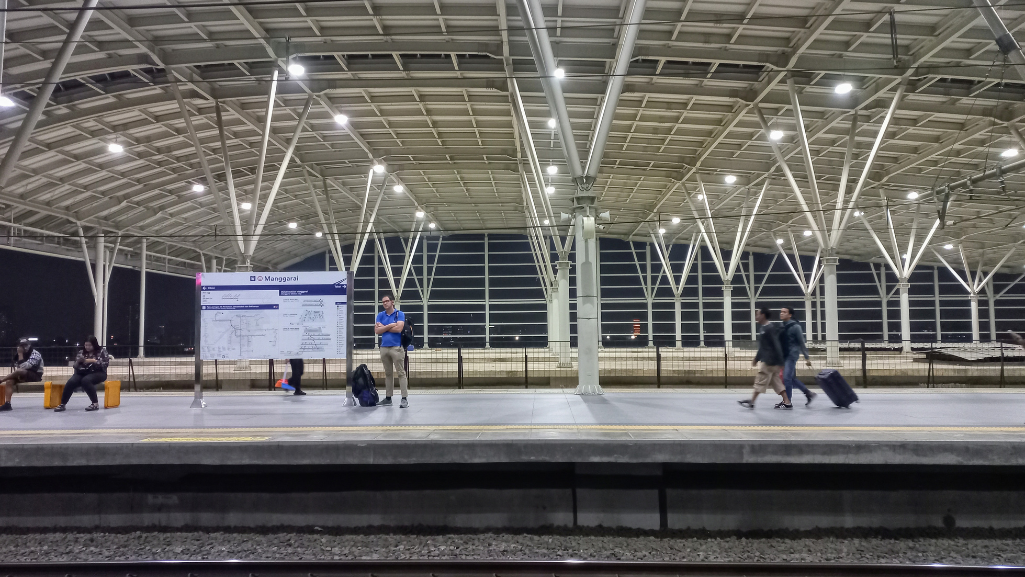
We focused on three stations on the Jakarta–Bogor commuter line in Indonesia, chosen to represent different spatial constraints: Manggarai (large station), Citayam (medium station), and Cawang (small station).
We observed weekday peak periods, built station models, simulated current conditions, and then ran a 10-year stress test without changing the layouts.
LOS and platform standards used
We used two complementary checks:
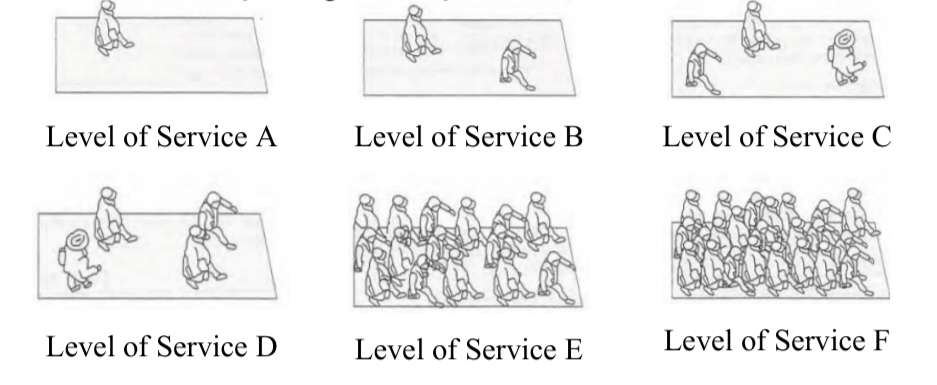
1. Operational LOS from pedestrian conditions
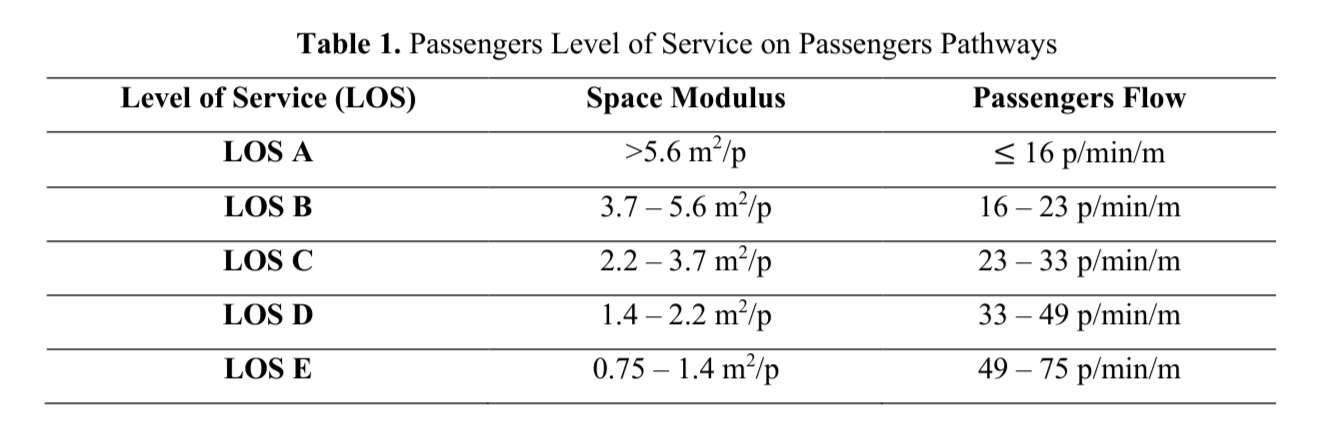
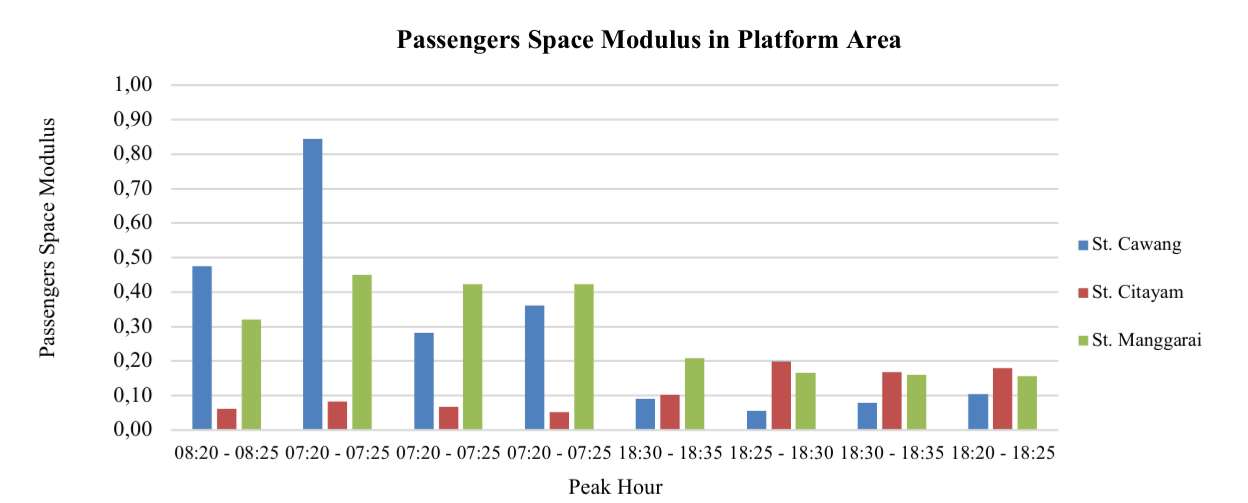
We assessed LOS using pedestrian service concepts based on space per person (space modulus) derived from density:
– Density, D = persons per m²
– Space modulus, M = 1 / D in m² per person
In simple terms, lower space per person means worse LOS.
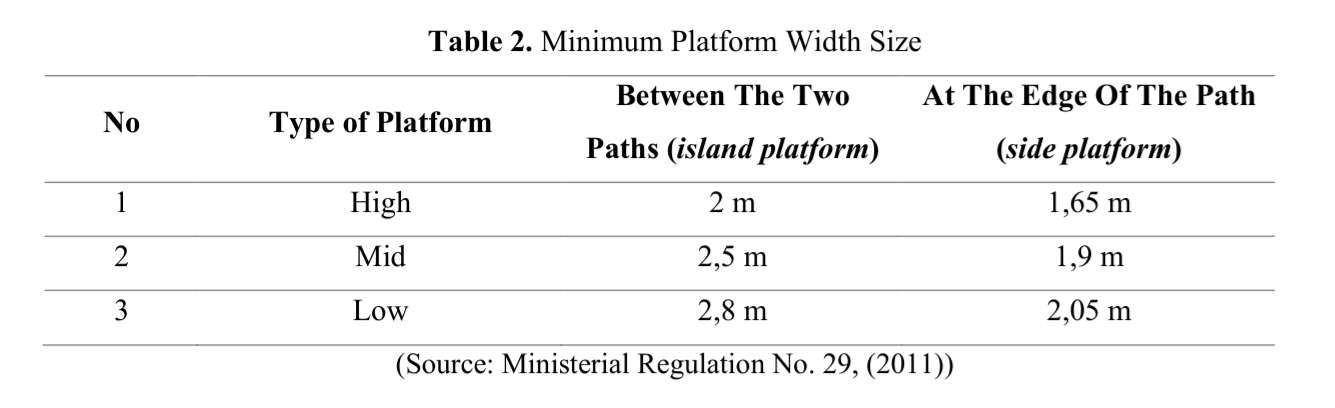
2. Geometric screening using minimum platform width
We also checked platform width against a published minimum standard by platform type and station class. This is a useful screening step, but it does not tell you where crowding concentrates or how long it persists.
Screening step: Platform width check
Before you simulate, a quick platform width check helps you prioritize where the risk is likely to be highest.
In the study:
- Cawang: platform width exceeded the published minimum, assessed as adequate.
- Citayam: platform width was below the published minimum, assessed as inadequate.
- Manggarai: platform width exceeded the published minimum by a wide margin, assessed as adequate.
In practice, this screening aligns with the simulation outcomes. The station with the tightest geometry (Citayam) was also the most sensitive to demand growth.
Rail station crowd simulation workflow
Below is the workflow we used. It is designed to be transferable.
1) Observe demand and directionality: Start with collecting counts during representative peaks. Then, keep directional flows separate. Platform behavior changes by direction and time of day. For this reason, we took observations on weekdays during 06:00-09:00 and 16:00-19:00.
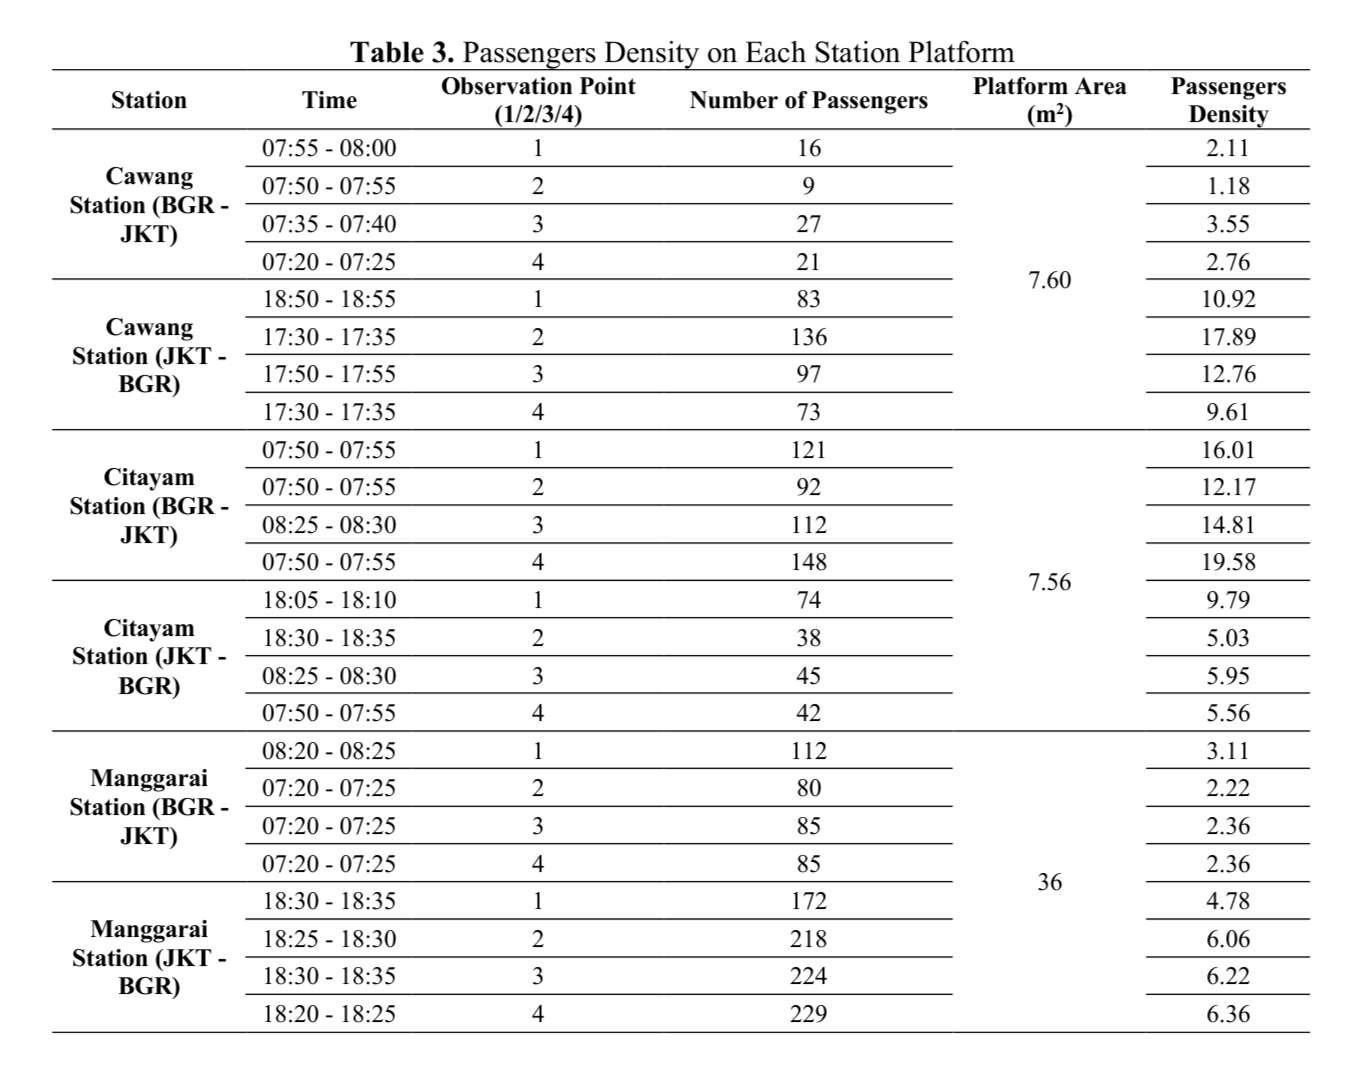
2) Measure density where it accumulates: Define observation zones on platforms. Count passengers in each zone at short time intervals. Convert counts to density using the zone area. Convert density to space modulus (M = 1/D) for LOS interpretation. A practical tip: use zones that represent decision-relevant areas, for example near stairs, gates, and typical waiting lines.
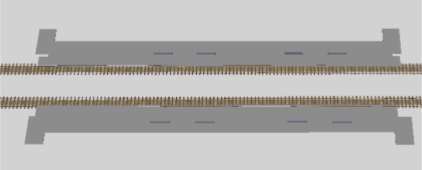
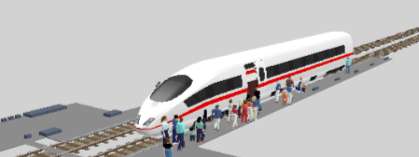
3) Build the station model in PTV Viswalk: First, replicate platform geometry and key elements that drive conflicts, such as access points and circulation paths. Then, encode pedestrian movements so waiting and circulation emerge from the layout.
4) Run two scenarios: Baseline (current volumes with the existing layout), and a stress test (higher demand with the same layout). In this study, we treat the future case as a stress test, not a forecast. Therefore, we compared baseline and stress-test outputs consistently across all three stations:
5) Perform a reasonableness check: Compare simulated versus observed volumes using a GEH-style test. Then, use it as a basic acceptability check, not as a full calibration report.
What the simulation showed
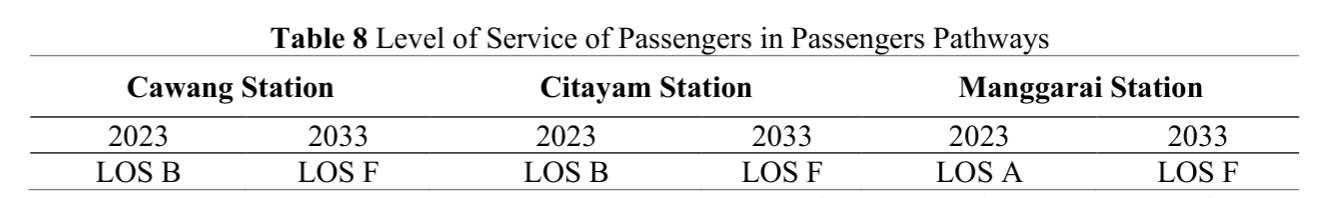
Station-level LOS shift under the stress test
At the station level, the study reports a clear shift from acceptable conditions to critical conditions under the stress test:
- Cawang: LOS B in baseline, LOS F in stress test
- Citayam: LOS B in baseline, LOS F in stress test
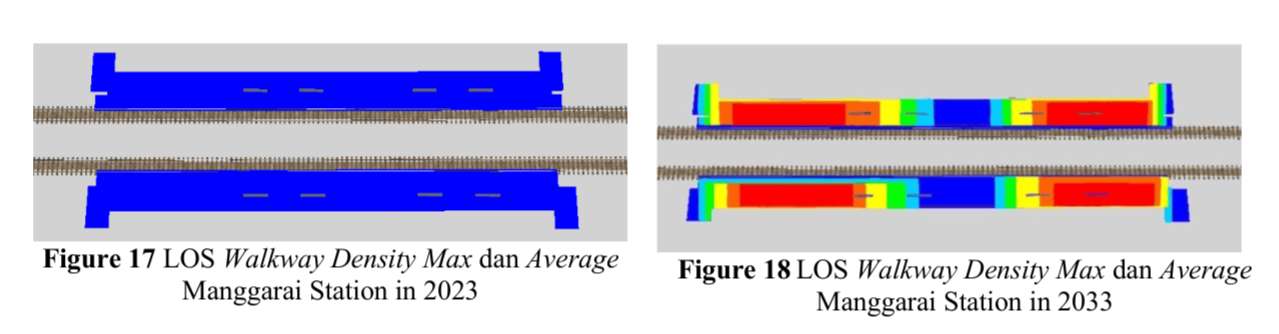
- Manggarai: LOS A in baseline, LOS F in stress test
The point is not that every square meter is equally crowded. The point is that the overall platform environment becomes operationally fragile when growth pushes you past thresholds.
Manggarai has the widest platforms in our sample, but the stress test still pushes parts of the platform into worse LOS.
Example: Why Citayam becomes decision-relevant
Citayam is where simulation adds the most value beyond a static width check.
- The platform width is already below the published minimum.
- In the stress test, the LOS visualization indicates widespread deterioration across the platform area.
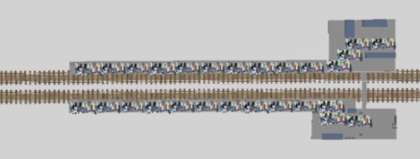
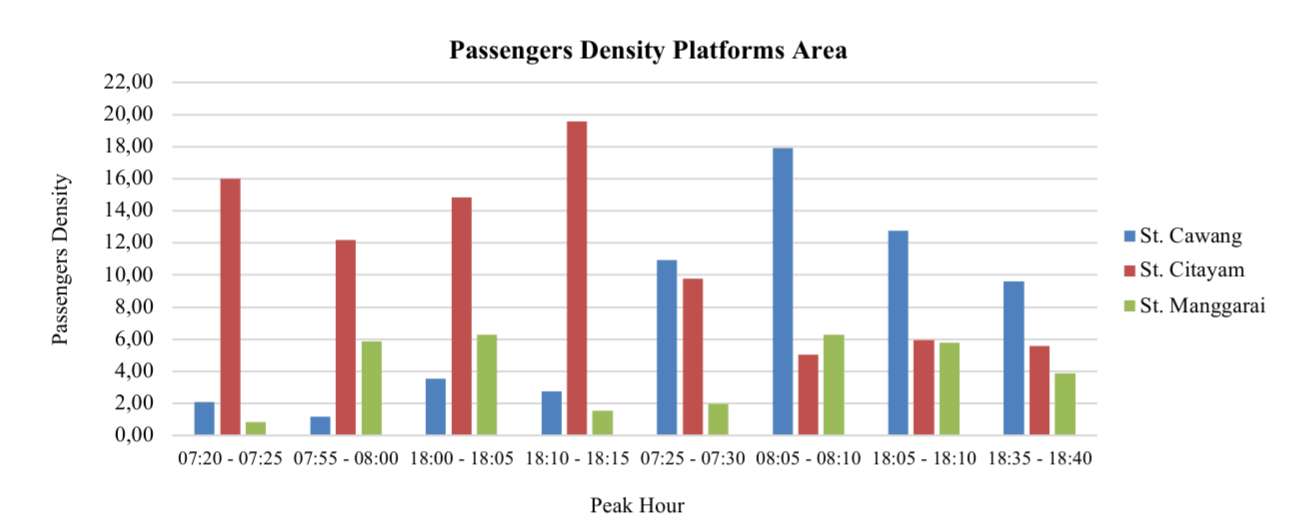
The study’s density measurements at Citayam also show how extreme crowding can get in small, constrained observation zones. In peak snapshots, spot densities in measured zones reached roughly low double digits to around 20 persons per m².
Engineers will recognize what this implies: once densities become that high in key waiting and conflict areas, small operational changes can trigger disproportionate service degradation.
How to use this approach in your projects
If you want to replicate this in your station portfolio, use this checklist.
- Step 1: Do a platform width screening to identify high-risk stations.
- Step 2: Collect peak counts with clear directionality, time stamping, defined zones, and measured platform dimensions.
- Step 3: Convert counts to density, then to space modulus for LOS interpretation.
- Step 4: Build a minimal, correct geometry model in PTV Viswalk, then expand only if needed.
- Step 5: Run baseline plus stress test.
- Step 6: Report outputs in an engineering-friendly format:
- A small number of hotspot zones
- Peak density ranges per zone
- A clear statement of when and where LOS becomes critical
- A short list of interventions to test next
What to test next (typical station interventions)
Our study highlights measures that are common across rail systems:
- Multistorey development where footprint expansion is limited
- Access capacity increases, for example more tap gates and better entry distribution
- Operational changes that reduce peak concentration
Remember, simulation is not the deliverable. It is a decision support tool to compare targeted options.
Conclusion
Rail station crowd simulation helps you move from generic statements about crowding to location-specific, time-dependent evidence.
In this study, using PTV Viswalk made it possible to quantify density and LOS from field counts; identify where crowding concentrates; and demonstrate how a stress test can shift stations into critical conditions.
If you already use static width checks or spreadsheet LOS labels, simulation is the practical next layer for prioritizing upgrades and defending decisions.

Simulate
Pedestrian Traffic with Confidence
Model crowd dynamics,
test scenarios,
and predict bottlenecks before deployment
Simulate Pedestrian Traffic with Confidence
Model crowd dynamics, test scenarios, and predict bottlenecks before deployment
Related Posts


