
Table of contents
Pedestrian evacuation simulation helps you stress-test egress performance in high-occupancy buildings before an incident forces you to rely on assumptions. In an emergency, you may have only minutes to move hundreds or thousands of people through constrained routes, often across multiple floors.
In our work at BUET-JIDPUS, we regularly see evacuation plans that look reasonable on paper but become unrealistic once density, stairs, obstacles, and human behavior are considered together.
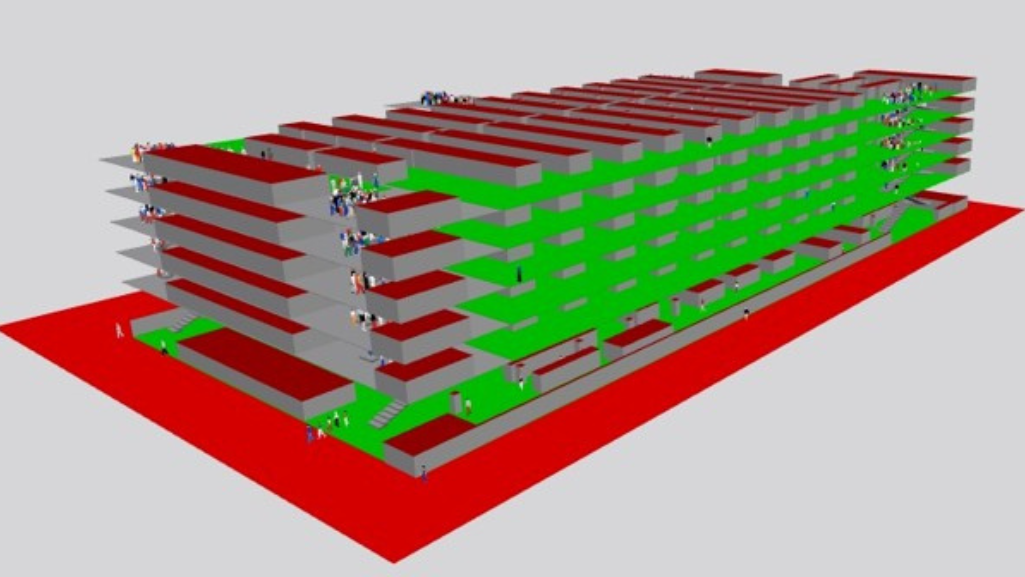
That is why we used pedestrian evacuation simulation in PTV Viswalk to estimate evacuation performance for a 5-storey ready-made garments (RMG) factory in Bangladesh with about 1,000 occupants.
This article focuses on what practitioners can reuse, including model setup, behavioral uncertainty, and how to communicate results defensibly.
Note: The article is based on the research paper “Viswalk microsimulation‑Based Evacuation Modeling of a Critical Infrastructure: A Social Force Model Approach”.
Why pedestrian evacuation simulation
A pedestrian evacuation simulation is most valuable when it produces outputs you can act on, not just a single time value. You can use it to:
- Identify which assumptions drive uncertainty, so you know what to validate, what to test in scenarios, and what to communicate clearly.
- Check egress capacity under stress and see whether evacuation performance is plausible for your building layout.
- Compare design and operational options before investing in physical changes, for example doors, stairs, obstacle clearance, or staging procedures.
The case study
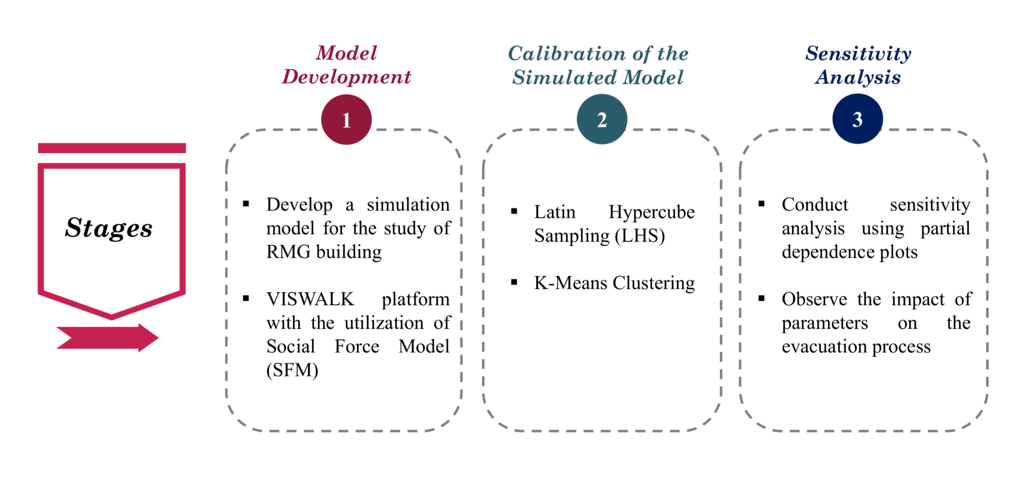
We built a PTV Viswalk microsimulation model of a 5-storey RMG factory to replicate the internal environment and movement constraints under emergency egress.
- Core setup choices (replicable):
- Obstacles: machinery represented as blockages, because they affect route capacity and queue formation.
- Occupancy: 1,000 pedestrians, aligned with the approximate facility capacity.
- Egress: stairs only, lifts excluded because they are typically shut down or risky during events such as fire or earthquake.
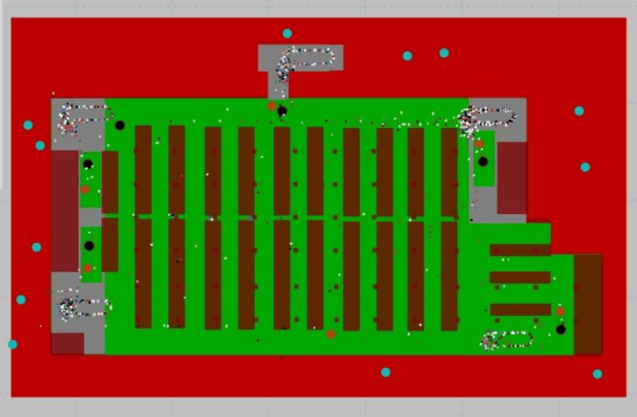
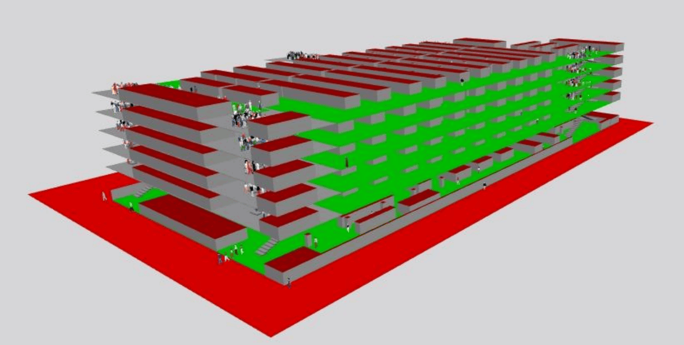
These details matter because evacuation performance is often dominated by local constraints, for example stair access, turns, merges, and pinch points near obstacles.
Behavior and calibration
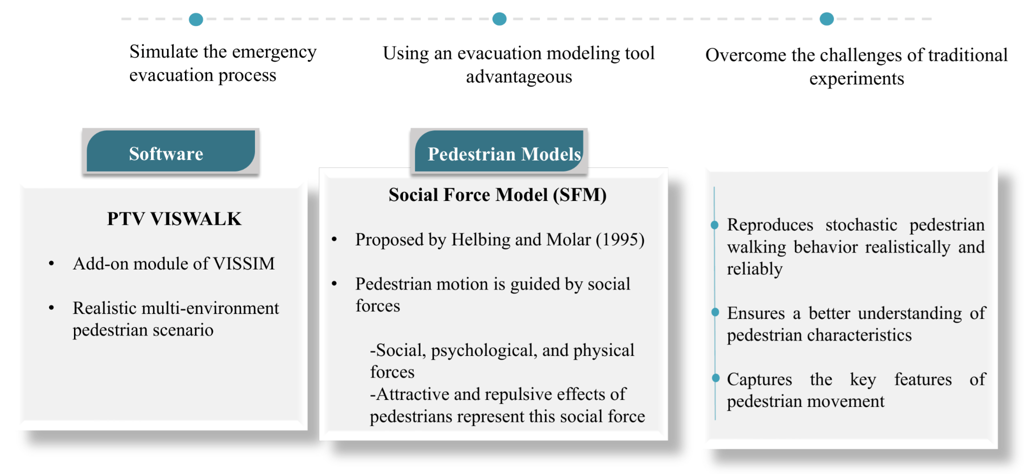
To represent emergency movement, we used the Social Force Model (SFM) approach available through PTV Viswalk walking behavior parameters.
In plain terms, SFM helps represent how pedestrians move toward a destination, interact with other pedestrians (including crowding effects), and avoid obstacles and edges.
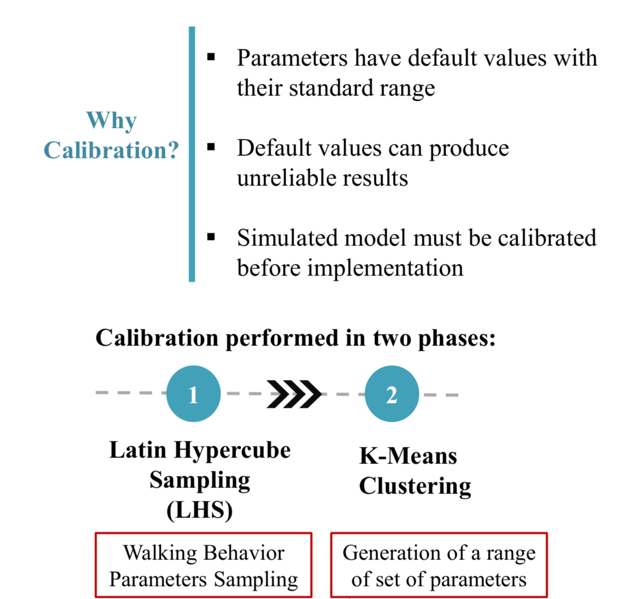
A practical issue is that default pedestrian behavior can produce smooth-looking animations but still deliver evacuation times that are hard to defend. For that reason, we treated calibration as a core part of the workflow, not a nice-to-have.
Our goal was not to claim one perfect behavior profile. Instead, we created a small set of “emergency scenario families” that can be explained to stakeholders and used to test design and operational changes.
Calibration workflow
We used a workflow that is easy to communicate to non-specialists: sample plausible behavior settings, then group them into scenario families representing emergency movement.
Step 1: Sample uncertainty (LHS)
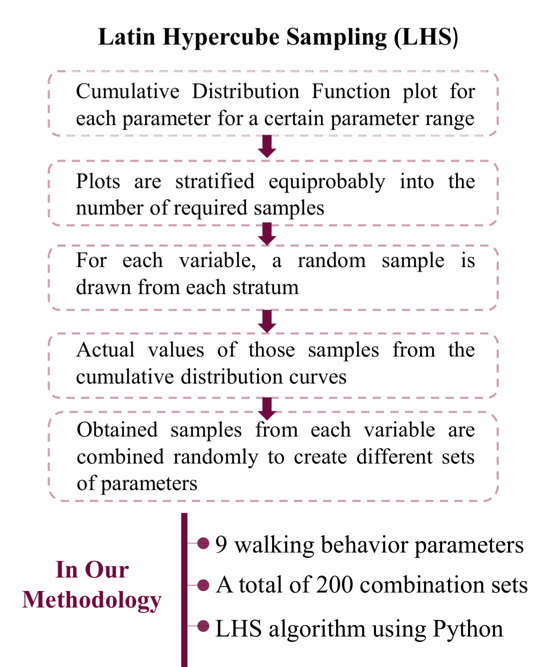
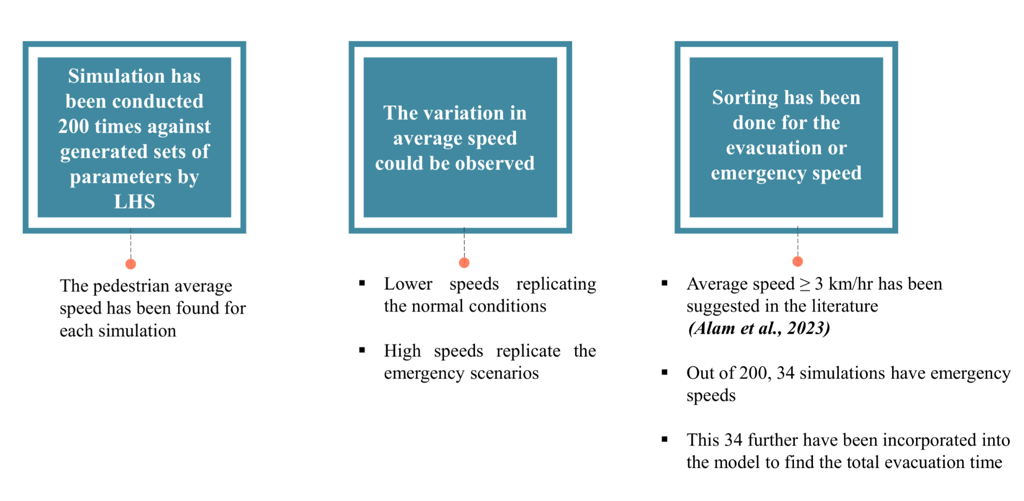
We generated 200 walking-behavior parameter sets using Latin Hypercube Sampling (LHS) in Python, then ran 200 simulations and extracted average speed for each run.
To focus on emergency-like conditions, we kept the runs with average speed above 3 km/h, which our study treated as an evacuation-speed benchmark based on prior literature. From the 200 runs, 34 simulations met that filter and were carried forward.
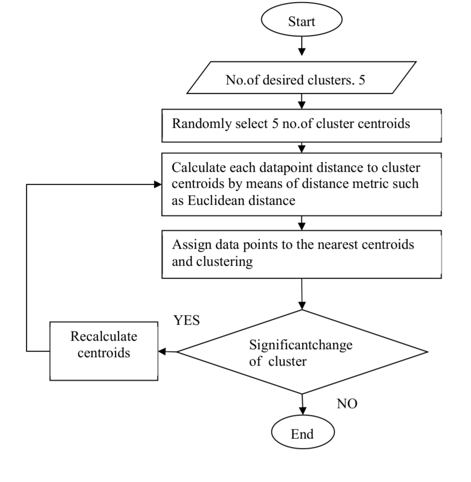
Step 2: Group scenarios (K-means)
We then applied K-means clustering to the “emergency speed” runs and extracted five clusters, because more than five did not show clear differences in parameter patterns.
This step turns many parameter combinations into a manageable set of scenario families you can test and compare, without pretending that one setting is universally correct.
Results
We used the following standard evacuation timing concepts:
- ASET (Available Safe Egress Time): time between emergency initiation and conditions becoming unsustainable.
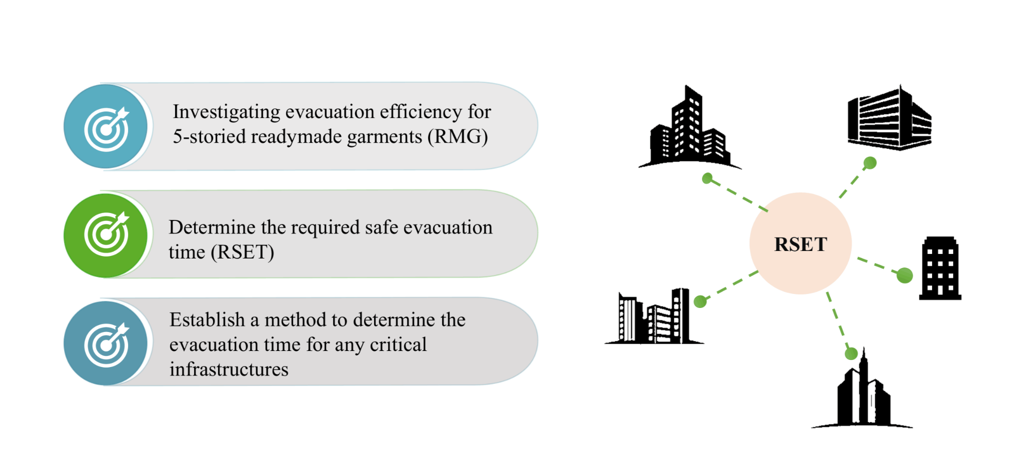
- RSET (Required Safe Egress Time): time required for the last occupant to exit the building.
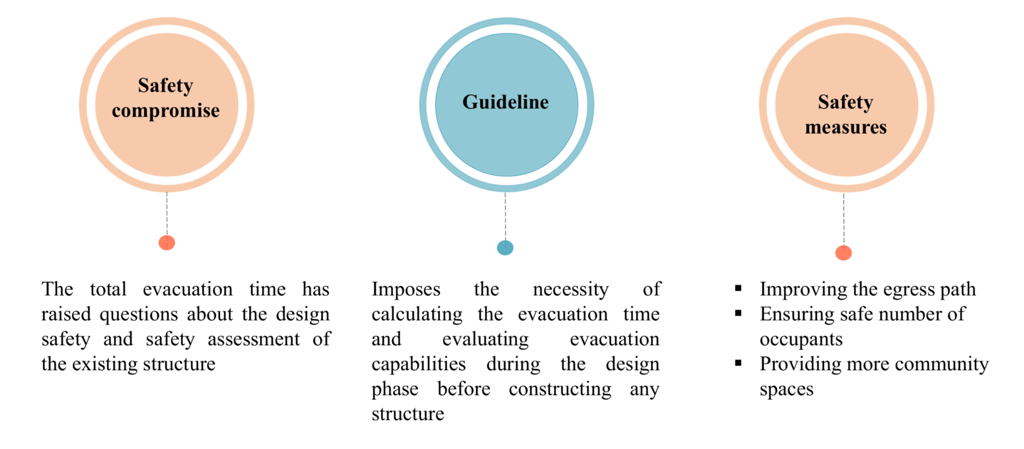
Across the five clustered emergency scenarios, the minimum total evacuation time observed was 8 minutes 7 seconds for 1,000 occupants.
To interpret this value, we compared it to an ASET benchmark of 5 minutes, based on reported fire drill surveys for structures with similar geometries. The 5-minute value is best treated as a contextual benchmark, not a universal threshold.
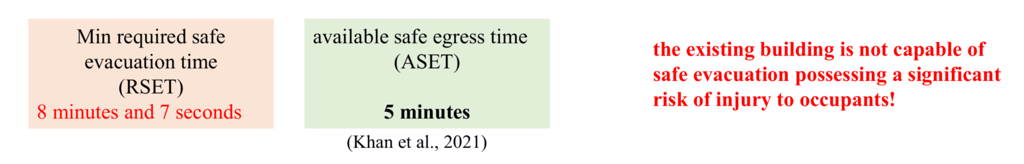
Even with that caution, the result signals a likely time gap between available conditions and required egress, and that is a strong reason to test interventions rather than relying on a single assumed behavior profile.
Sensitivity
To make calibration more explainable and repeatable, we ran a sensitivity analysis using partial dependence plots (PDPs) to see how individual parameters relate to average speed while holding others constant.
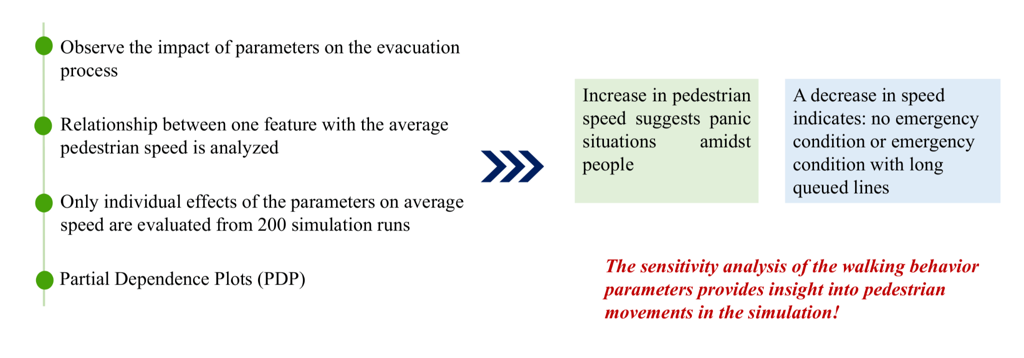
We observed clear influence from:
- Relaxation time (τ)
- Lambda (λ)
- VD (response to grouped people in counter flow)
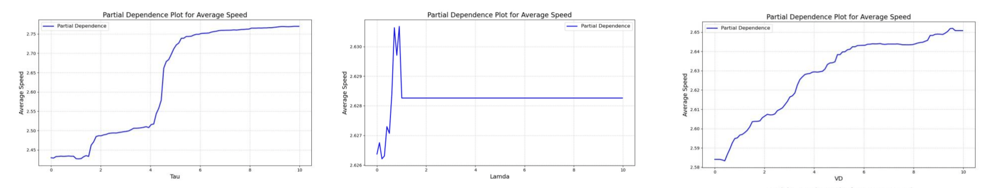
Other parameters were influential but showed less obvious trends, and BSocMean did not show an evident correlation in the study runs.
Tip: sensitivity results help you recalibrate faster. If simulated movement looks unrealistic, PDPs indicate where to focus first instead of retuning everything blindly.
How to apply
If you are planning evacuation for a similar facility, this sequence is practical and defensible:
- Model geometry honestly, include stairs, door widths, obstacles, and constraints that reduce capacity.
- Treat behavior as uncertain, sample behavior (LHS or equivalent) rather than choosing one profile by intuition.
- Report a range, decision-makers need best-case to worst-case outcomes, plus assumptions that drive the spread.
- Prioritize interventions, test measures such as egress improvements and obstacle removal before committing to construction or policy changes.
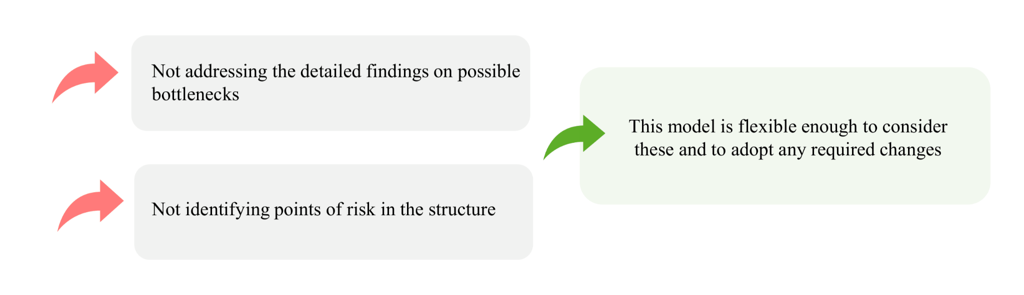
Two limitations are worth stating clearly, because they affect how results should be used:
First, we did not provide detailed bottleneck mapping and risk point identification in this study, although the model framework is flexible enough to extend in that direction.
Second, the ASET comparison uses a benchmark derived from reported drills in similar geometries. It should be adapted to local hazard assumptions, detection times, procedures, and tenability conditions.
Practitioners should also be explicit about what is included when reporting RSET components, for example whether pre-movement time is included.
Conclusion
Using PTV Viswalk microsimulation combined with SFM-based walking behavior and calibrated with LHS and K-means provides a defensible way to estimate evacuation performance in dense, multistory facilities.
However, modeling does not replace judgment. Pedestrian evacuation simulation can prevent high-stakes decisions based on a single drill or assumed behavior profile. It also provides a structured way to test improvements before investing.

Plan for safer pedestrian flows
Use simulations to plan trustable emergency egress, evaluate layouts, bottlenecks, and evacuation performance
Traffic simulation for evacuation scenarios
Plan trustable emergency egress, evaluate layouts, bottlenecks, and evacuation performance
Related Posts


