Table of contents
- Pedestrian simulation for major events: method
- Night-time baseline: stationary demand
- Peak movement: build moving demand
- Re-optimize for peak corridors
- Pedestrian simulation for major events: Why Vissim and Viswalk
- Service entrances as bottlenecks
- What changed after simulation
- Pedestrian simulation for major events: Lessons for planning teams
Planning a major event using only one static demand point can provide sub-optimal service locations required to keep people safe at such events. Demand can be concentrated overnight at accommodation sites, then shift to a few transport corridors during peak times. Those peak times are also when safety risk and operational sensitivity are highest.
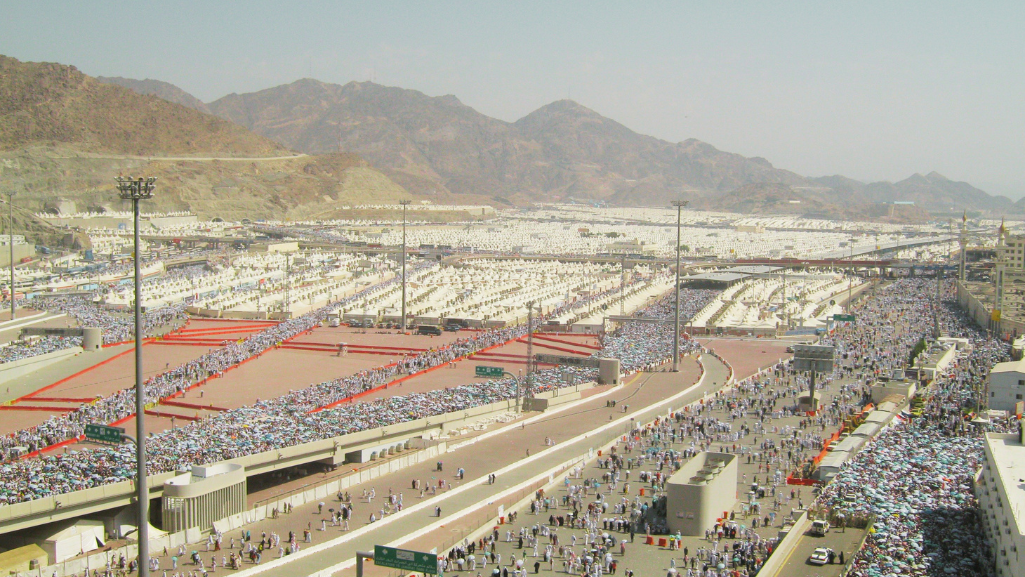
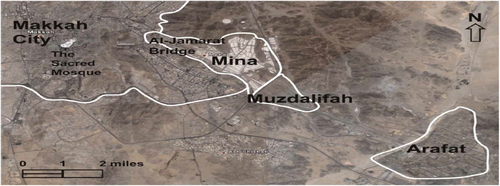
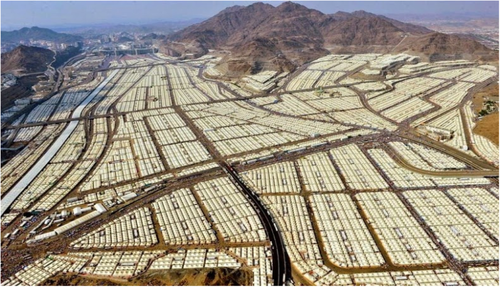
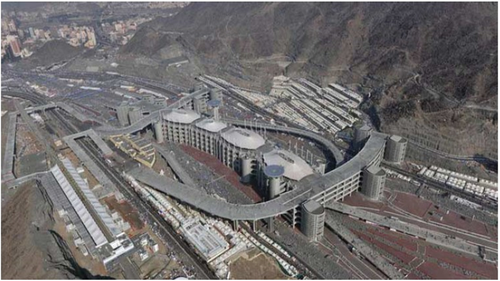
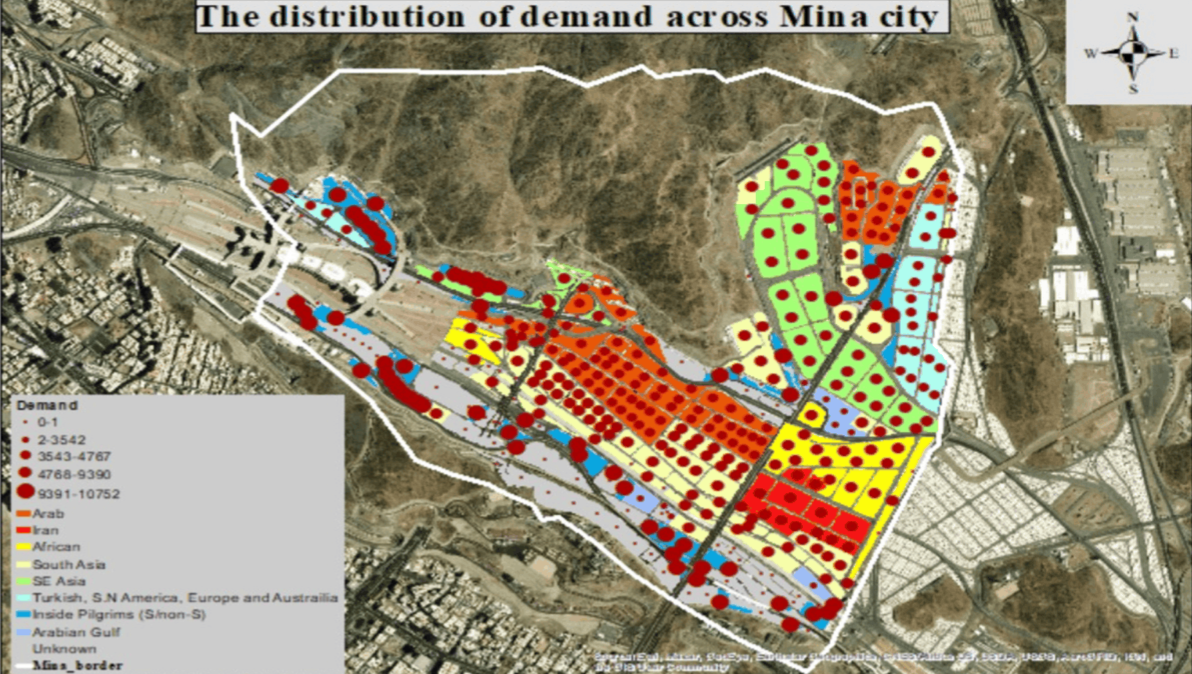
We explored this issue in Mina, Saudi Arabia, during the Hajj. Mina operates as a temporary tented city during this major religious festival. During the festival, large flows of pilgrims move slowly from the tented city towards the focal point of the festival, Jamarat Bridge (where they ‘stone the devil’) along a network of pedestrian walkways or corridors.
While we focused specifically on health services, the same logic applies to other services that trigger stopping and queuing, for example water distribution, security checks, toilets, and wayfinding information sites.
The core question: Where should services be placed in a temporary city, so they remain accessible during peak movements, without creating bottlenecks through people stopping and queuing?Note: This article is based on the academic paper Location models to improve health and safety at a major temporary city: The case of the Hajj.
Pedestrian simulation for major events: method
This example of pedestrian simulation for major events uses a combination of techniques, not a single modelling technique. Specifically, we combined two complementary methods:
First, location-allocation models identified optimal service locations to improve walking-distance coverage for a dispersed population. These models effectively minimize the distance people must travel to access a given number of services.
Second, we created a pedestrian microsimulation, or agent-based, models in PTV Vissim and PTV Viswalk. These models tested whether the candidate locations would remain safe locations during peak pedestrian traffic movement. Merge points or junctions, pinch points, bottlenecks, and service entrances and exits can affect safety at peak times.
The key point is combining methods. Location allocation supports the search for optimal service locations. Agent-based modeling supports understanding how individuals (or agents) react around those service locations.
Used together, these methods reduce the risk of an optimal service location failing due to congestion or trampling, which can lead to injuries or even death. The Hajj, for example, has experienced many tragic deaths from stampedes around queuing pedestrian traffic.
Night-time baseline: stationary demand
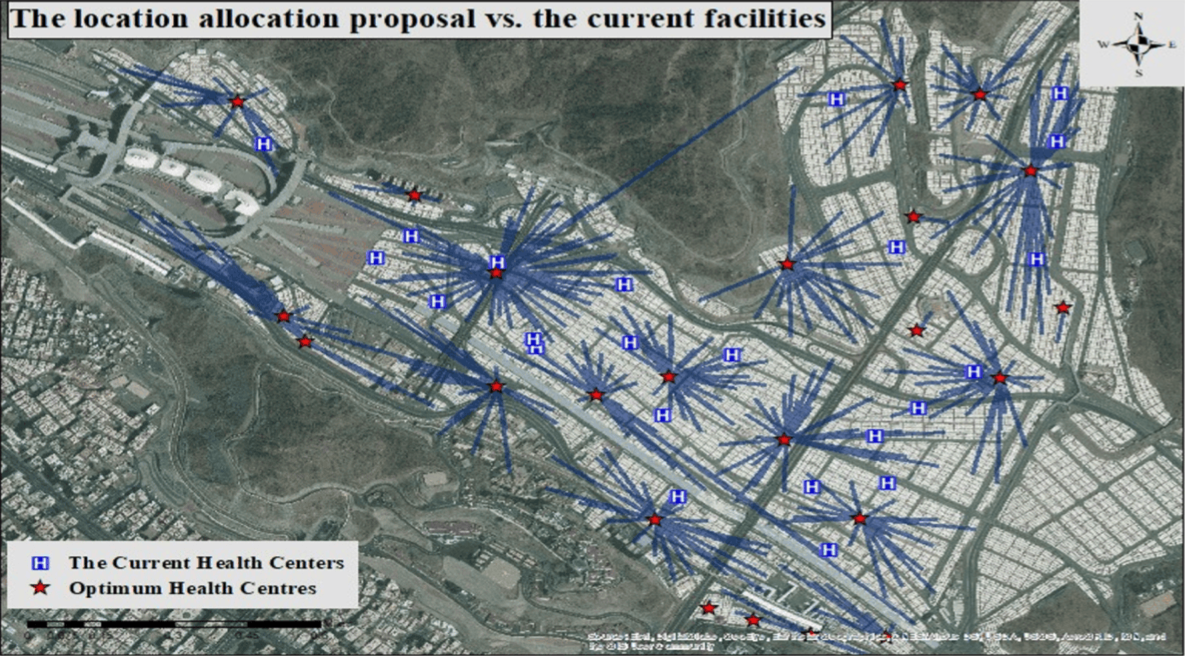
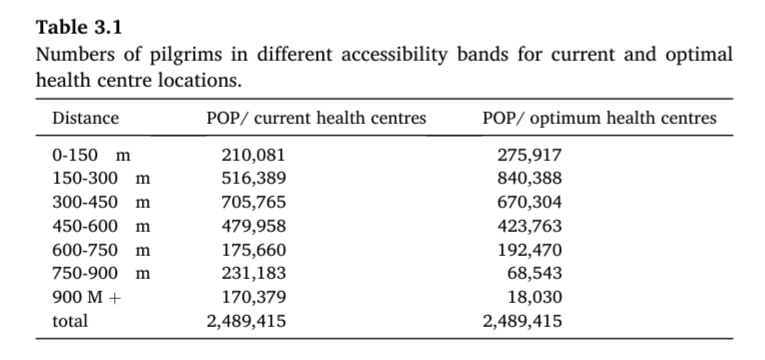
We started with a stationary demand pattern in which the population is concentrated in accommodation areas (the tented city) overnight. In that state, we compared the locations of existing health services with a modeled “optimal” alternative set that improves accessibility.
This baseline is valuable for two reasons. First, it quantifies coverage when demand is stable. Second, it provides a defensible starting configuration for service planning.
However, it also exposes a limitation. The nighttime population distribution can become less relevant when the crowd starts moving.
Thus, the question changes. An analysis based on nighttime coverage alone is insufficient. It is also important to consider where people will be during peak-time movements.
Peak movement: build moving demand
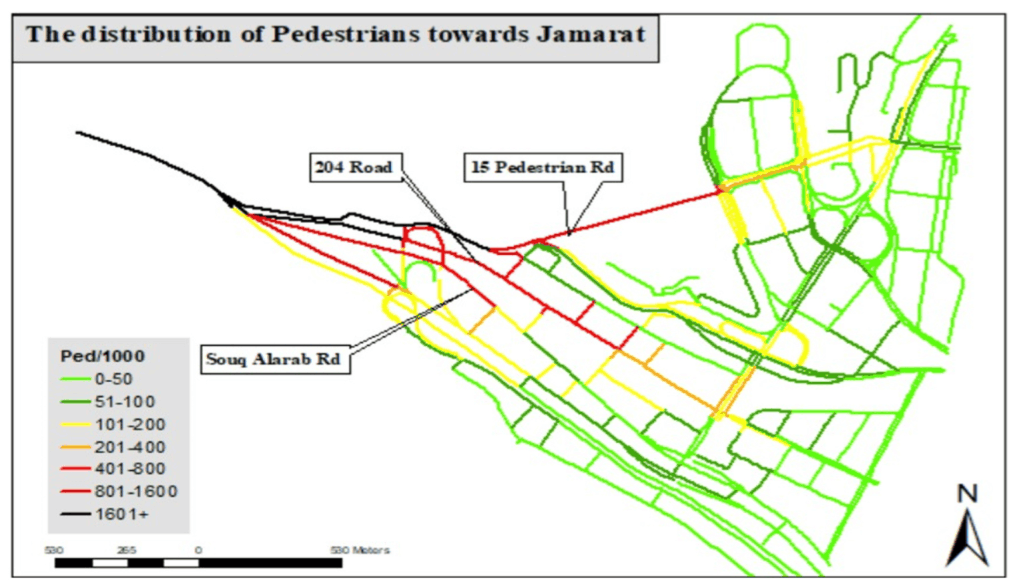
Next, we replicated daytime conditions by converting the nighttime population distribution into movement patterns toward the Jamarat Bridge. This created a transient demand layer along the pedestrian network.
For practitioners, this represents a critical change in perspective. We are no longer optimizing service locations based solely on the nighttime population. Instead, we optimize service locations based on demand along the pedestrian networks, thus making time of day crucial.
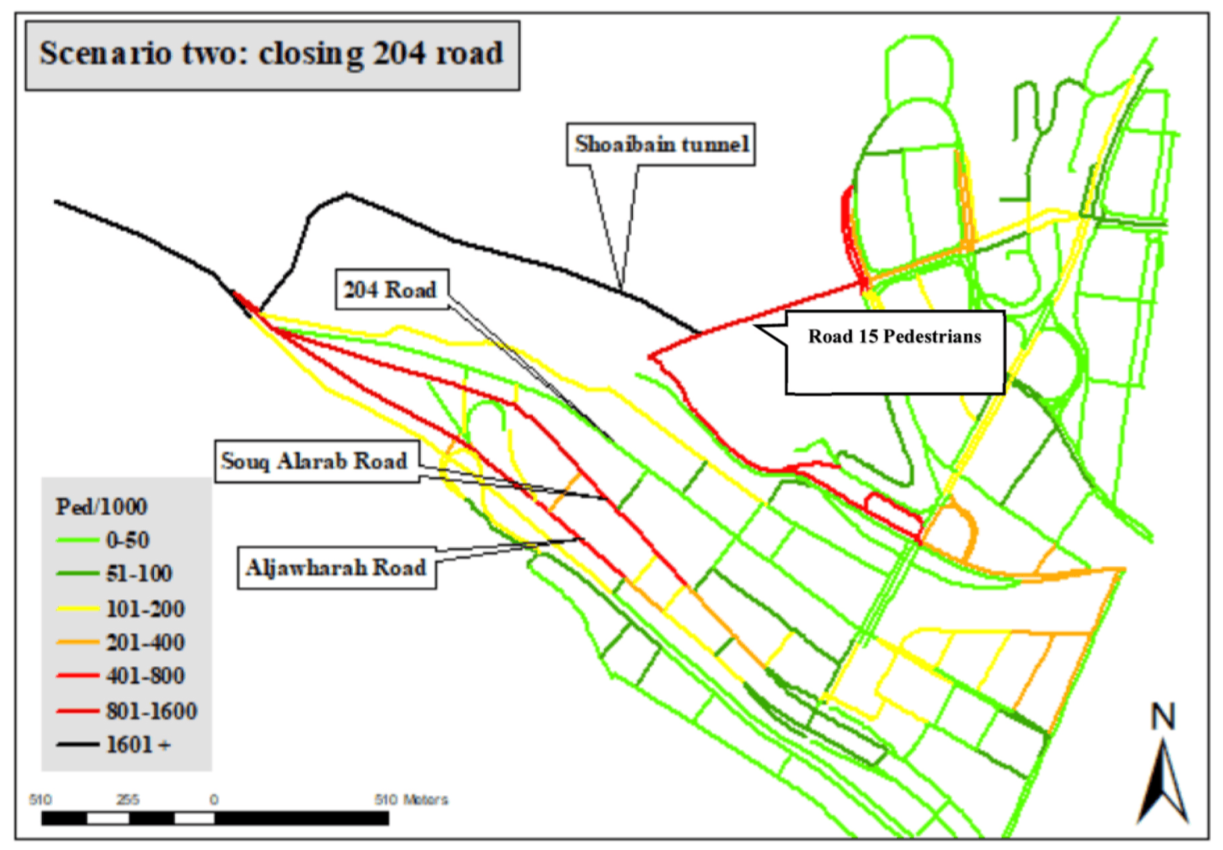
This transient demand view also supports operational sensitivity tests. Route closures and incident response measures (e.g., in the event of accidents or emergencies) may trigger rerouting. When that happens, congestion can form quickly elsewhere. Service accessibility may also need to change. A plan that ignores these demand shifts has a fragile design.
Therefore, we used the moving-demand representation as the basis for the next step.
Re-optimize for peak corridors
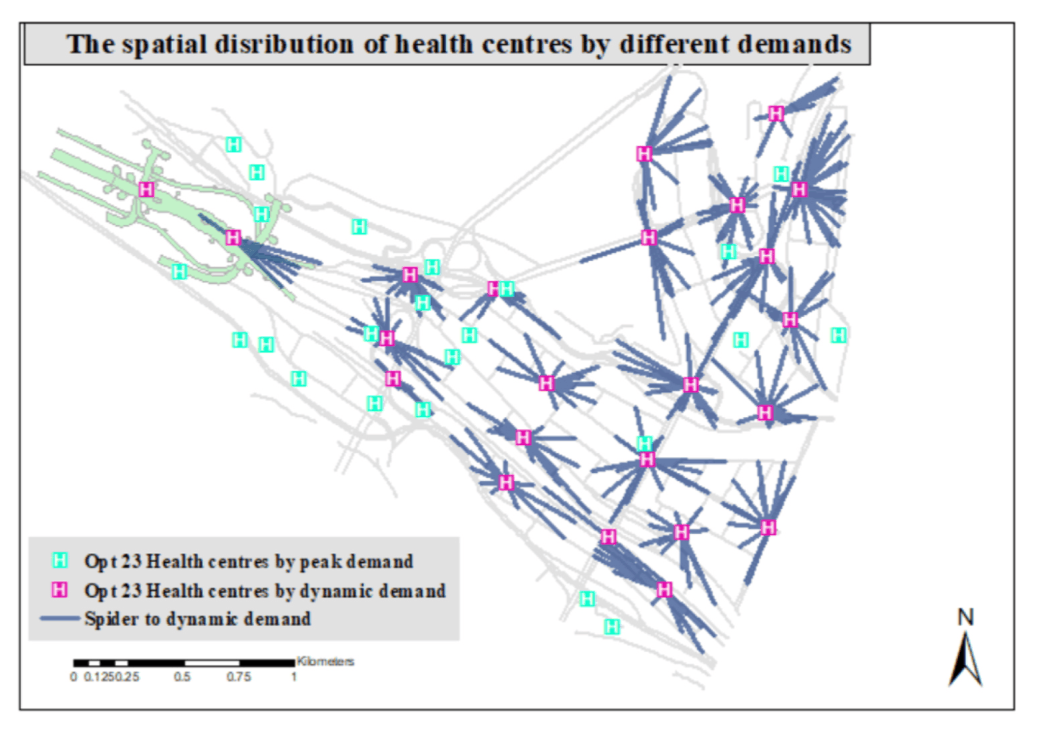
Next, we re-ran the location-allocation models using the transient demand patterns. The recommended service locations naturally shifted towards the main pathways and peak movement corridors.
This shift has a practical solution. It shows where services need to be at different times of day to remain accessible to the greatest number of pilgrims.
However, these locations may create a new risk. Placing services closer to major pedestrian routes can increase congestion. Stopping to use services can create queues, which can cause potential trampling or stampede behavior.
This is where many event plans fall apart. The service is in the “right” place on a map. Yet, on the ground, it becomes a bottleneck.
Pedestrian simulation for major events: Why Vissim and Viswalk
To recap, location-allocation modeling helps identify potential locations for service provision. However, it does not indicate whether those locations can operate safely under peak flows. Specifically, it cannot depict the interaction between stopping, merging, and queuing at service entrances and exits.
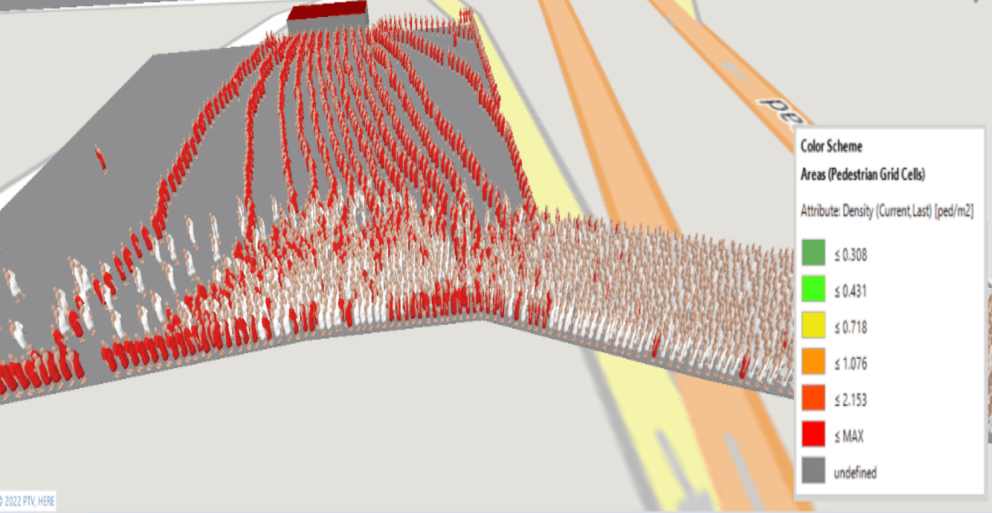
PTV Vissim with PTV Viswalk addresses this operational gap. It allows you to understand pedestrian behavior at potential locations where problems may occur, such as pinch points around service locations. It also supports density and congestion analysis using a level-of-service concept.
In short, these agent-based models turn “this location should be accessible” into “this location will still work when people stop, queue, and interact.”
Service entrances as bottlenecks
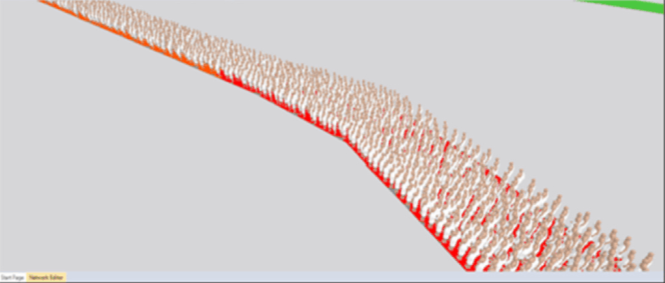
Many health centers in Mina were located close to roads to maximize accessibility. The simulation described above revealed a trade-off. If a service is located directly on or very close to the main transport corridors, even modest stopping behavior can trigger queuing and potential trampling. Congestion then forms at the worst possible place: on the dominant movement paths.
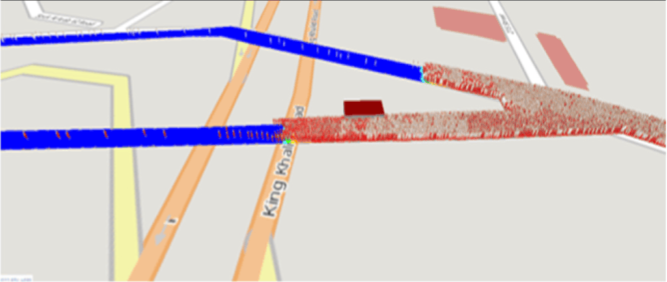
We tested a mitigation strategy that could be applied to other major events. We moved the optimal service locations away from the main corridors and created a dedicated waiting area with an organized queuing layout. The intent is straightforward. The service remains accessible, but individuals wait off the main transport corridors.
Thus, this is an optimal design question, not just a location question. The access geometry and waiting space often determine whether a service supports or undermines safety.
What changed after simulation
The most useful outcome was a clearer design rule for service access during periods of heavy pedestrian traffic.
In this case, setting services back from the main corridors and providing explicit queueing spaces and short connector paths reduced corridor congestion compared to an entrance from the corridor itself.
The simulation would allow policymakers to view alternative solutions. Agent-based models tested whether pedestrians would stop and queue, which could block movement at key bottleneck hotspots. This made it easier to justify potential safer solutions to stakeholders who require evidence, not intuition. Thus, the value lies not only in the “best” locations. Rather, it lies in the ability to validate a service concept as an operational element of crowd behavior modeling.
Pedestrian simulation for major events: Lessons for planning teams
For mobility and engineering professionals, the Hajj case reinforces a consistent pattern. High-impact failures are often local, predictable, and avoidable. These failures occur when waiting and congestion take place along key pedestrian routes, especially when disruption shifts demand onto smaller corridors that were not designed to accommodate increased numbers of people.
A robust plan keeps services accessible while separating waiting from movement. Such a plan remains workable even when there are closures, control measures, or changes to the way people move, congregate, and stop.
If you take away only one thing, make it this: When dealing with a largely transient population, design service locations so that they remain accessible without becoming a major hazard to pedestrian movement.

Model pedestrian movement for
major events
PTV Viswalk and Vissim test crowd flow, bottlenecks,
and service placement
before peak periods
Step up your Public Transport Planning Game
Discover our Ultimate Guide to The Best Public Transport Service Planning
Related Posts


