
Table of contents
Two escalators or three? Widen the tunnel or keep the retail space?
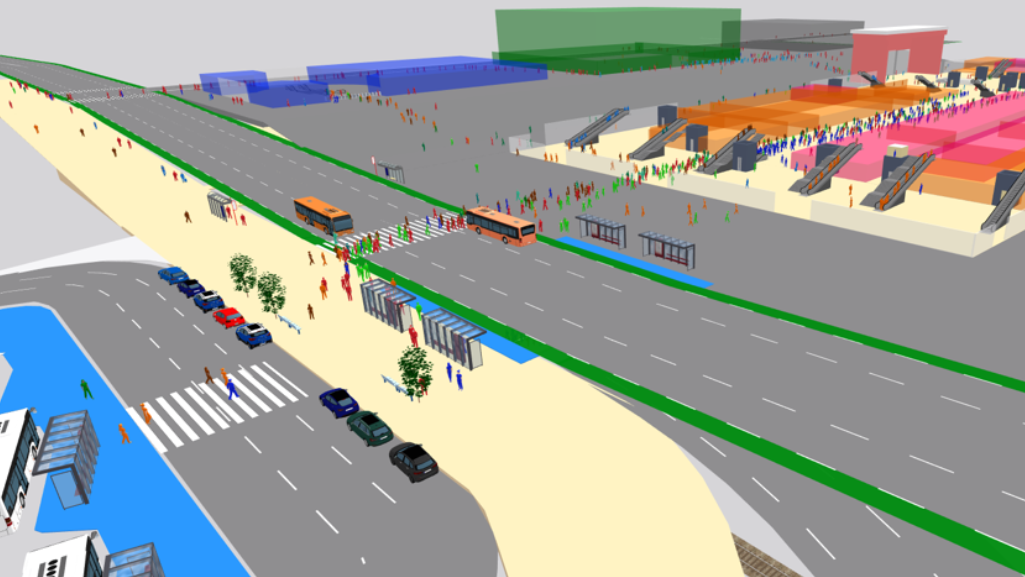
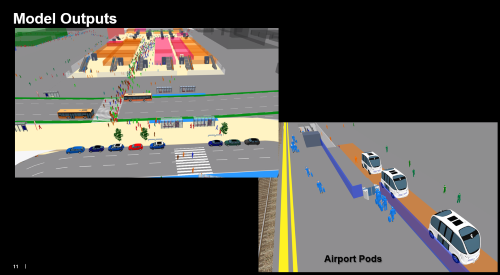
To move from opinions to evidence at San Jose Diridon, we built a train station pedestrian flow simulation in PTV Vissim.
In this simulation, we combined static and dynamic routing, included passengers with restricted mobility, and compared transfer times across design options, making the trade-offs explicit.
We used PTV Vissim because it models rail and LRT operations plus on‑demand triggers in one environment. It retains pedestrian fidelity. If you use PTV Viswalk, the crowd‑flow concepts and evaluations are transferable.
Project goals
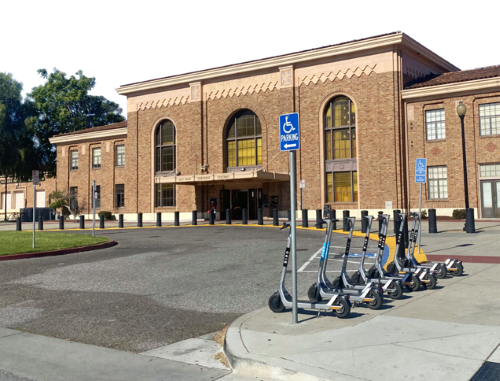
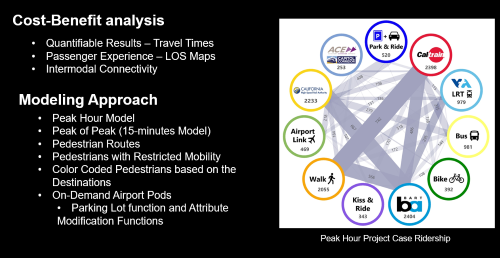
San Jose Diridon, a historic passenger rail depot, is the region’s intermodal hub. It is currently served by Caltrain, Amtrak, ACE, and VTA light rail. A BART (Bay Area Rapid Transit) rail service is also planned as part of the Silicon Valley extension, which will integrate with the California High-Speed Rail system (CAHSR).
Therefore, the redevelopment project aims to transform the station into a high-performing transit hub capable of handling much higher demand and complex transfers.
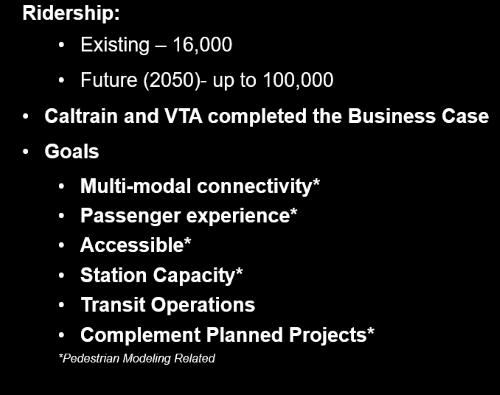
In addition, the goals were: multimodal connectivity, passenger experience, accessibility, station capacity, transit operations, and complementing planned projects.
What we modeled in train station pedestrian flow simulation
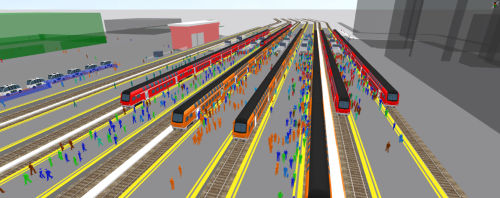
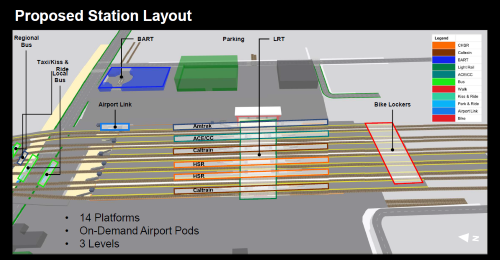
The number of daily riders is projected to grow from approximately 16,000 to approximately 100,000 by 2050. The proposed layout adds 14 platforms across three levels. There will be platforms on top, a large concourse beneath them, and an LRT below, with two connections to the separate BART station (surface or tunnel link).
We simulated a peak hour with a 15-minute peak-of-peak period, using static routing for baseline paths and dynamic routing to capture adaptation as densities rise. The model included passengers with restricted mobility and an on-demand airport link, coded via a Vissim “helipad trigger.” Dynamic assignment updated perceived path cost (distance plus density or queue penalties). We applied light smoothing to avoid oscillation.
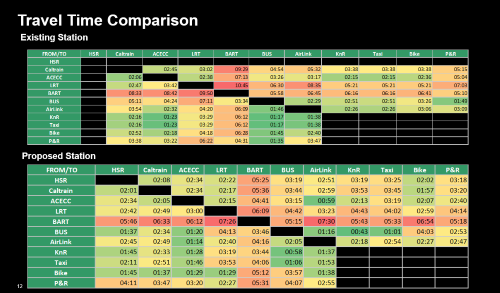
The cost-benefit analysis focused on three quantifiable aspects: transfer and vertical circulation travel time, passenger experience (clearance times, densities, and queues), and intermodal connectivity – how reliably and comfortably people reach connecting services.
Design choices at Diridon must work for Caltrain, Amtrak, ACE, VTA light rail, and the planned BART and CAHSR interfaces. The simulation evaluated the passenger experience and reliability of each interface under a common demand and timetable set.
Results at a glance
Key outcome: 404,000 person‑hours/year saved inside the station (reduced walking/queuing), about 1,100 person‑hours/day on a 365‑day basis.
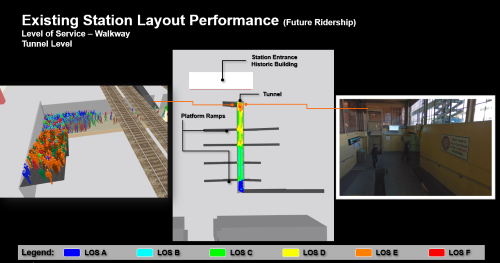
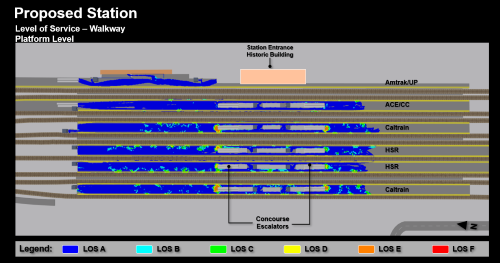
Existing vs. proposed: Under future demand, the existing tunnel concentrates flows, causing sustained queues and poor surge resilience. The proposed three‑level layout with a larger concourse meets platform/concourse clearance targets and improves connectivity to BART and LRT.
Accessibility & resilience: Modeling restricted‑mobility passengers revealed vertical‑link constraints. Recommendation: add at least one escalator and widen the tunnel to protect performance and ensure resilience if an escalator is out of service.
Surge handling: Static routing set baseline paths; dynamic routing re‑routed when local density/queues crossed thresholds, with 10‑second cost updates and light smoothing. This identified where two escalators were insufficient and how a wider tunnel limits delay propagation.
Passenger experience metrics: Reported transfer‑time and clearance‑time changes and checked densities/LOS against project targets; the proposed design met or improved these thresholds.
Vissim and Viswalk
Practitioners often ask whether they should use Vissim or Viswalk for a station project. For example, Viswalk is PTV’s pedestrian simulation product, and its crowd models and analyses map well to hubs.
In our case, Vissim provided the multimodal and service trigger integration we needed for trains, LRT, and on-demand links while retaining pedestrian fidelity. Teams that already use Viswalk will recognize the logic and metrics, and the lessons are portable.
Practical tips for planners
Use this checklist for a train station pedestrian flow simulation (or transit‑hub review); it distils the Diridon lessons into a minimal, repeatable method:
Scope scenarios: Simulate a peak hour with a 15‑minute peak‑of‑peak; apply today’s demand and the forecast to both existing and proposed layouts.
Map OD pairs: Report transfers that decide the connection’s reliability. In our case these were Platform↔Platform (Caltrain↔BART), Platform↔LRT, Surface↔BART, and Platform↔Surface.
Model accessibility: Define a share of restricted‑mobility passengers; set reduced speeds, elevator/escalator preferences, and luggage penalties.
Build the baseline: Start with static routing; verify geometry and wayfinding before adding complexity.
Add dynamic routing: Update perceived path cost (distance + density/queue penalties) when density or queues cross thresholds; allow reassignment every 10 seconds with light smoothing.
Design for resilience: Test out‑of‑service escalators and other contingencies; the “third escalator” at a pinch point is often risk mitigation.
Model service triggers: Include on‑demand connectors (e.g., an airport link) via simple event logic so rail/LRT/pedestrians run together.
Validate and calibrate: Back‑cast against current platform clearance and tunnel density; calibrate pedestrian speeds to on‑site observations.
Report what matters: Publish transfer‑time and clearance‑time against acceptance thresholds (target densities/LOS, max clearance). Convert improvements to person‑hours saved per year.
Conclusion
Use simulation to identify bottlenecks early and convert design options into measurable transfer time and clearance time improvements that riders and operators notice in daily service. For San Jose Diridon, this train station pedestrian flow simulation turned opinions into evidence – grounding transit hub decisions in quantified performance gains.

Run pedestrian‑flow check before you build
Stress‑test your hub’s design with PTV Vissim & Viswalk
Run pedestrian‑flow check before you build
Stress‑test your hub’s design with PTV Vissim and PTV Viswalk
Related Posts


