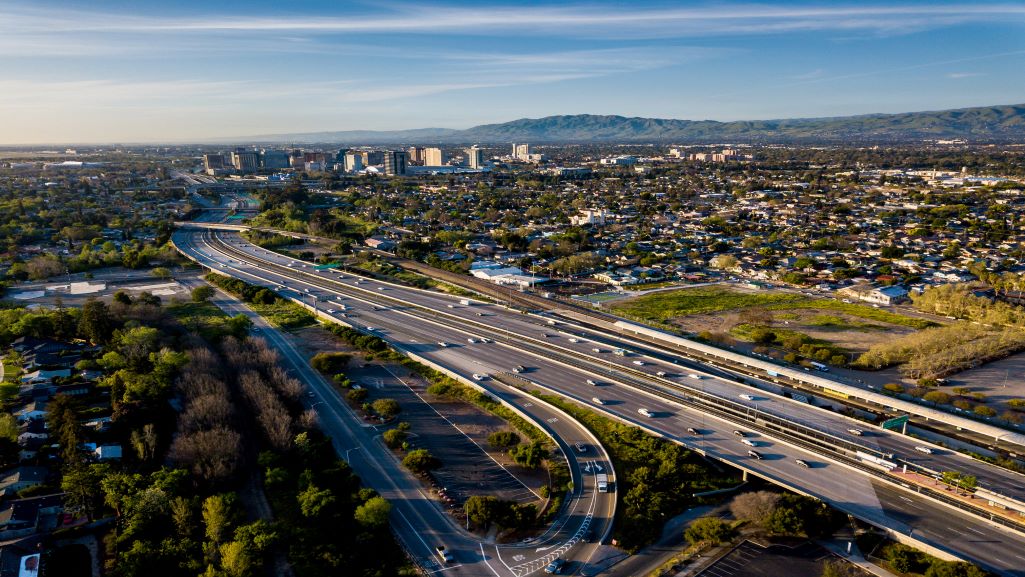
The Santa Clara County in California is often referred to as the Silicon Valley, as it is a global hub of the tech industry. That resulted in huge population rise over the last decades – causing many of its main roads to become congested. To combat the trend, the region’s transport authorities recently deployed advanced intersection analysis strategies, to ease traffic and better manage multimodal mobility.
We spoke with Eugene Maeda, a Senior Transportation Planner at the Santa Clara Valley Transportation Authority’s (VTA), about the impact of intersection analysis, in which PTV Vistro software was used.
Adapting and rightsizing
PTV: What is the current mobility and transportation situation in Silicon Valley?
Eugene Maeda: Silicon Valley has a multimodal network of toll lanes, expressways, train, bus, paratransit services, and bicycle lanes. This supports its 1.9 million residents and regional commuters in a transitional suburban-urban land use environment, with low-mid range densities and high auto mode-share. The major trip generators are high-tech employers, an international airport, large retail shopping centers, amusement parks, sports stadiums, and schools.
PTV: What challenges is Santa Clara Valley Transportation Authority (VTA) facing?
Eugene Maeda: The key challenge for VTA is adapting and rightsizing the mix of transportation investments and public transit services to the new post-pandemic congestion level baselines, and land use and travel patterns. Other challenges include on-going maintenance of existing transportation infrastructures and roadside assets, identifying and securing funding resources for transportation improvement projects, and coordinating multijurisdictional countywide congestion management efforts to insure consistency within the region.
User-friendly software
PTV: What factors went into choosing PTV Vistro as a traffic analysis tool?
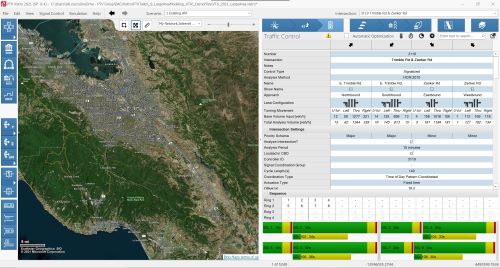
Eugene Maeda: The key factors that guided VTA to choosing Vistro was the user-friendly software interface, ability to analyze and manage multiple scenarios using current Highway Capacity Manual and ITE Trip Generation methodologies for a network of 250+ intersections, and compatibility with micro/macro simulation tools and other software. Also, it was important that the software was intuitive and easy to learn for staff, the calculations and selected methodologies were transparent, as well as having the flexibility to produce custom reports with consistent intersection analysis outputs.
PTV: What are the primary uses of PTV Vistro at VTA?
Eugene Maeda: Vistro will primarily be used to analyze a 252-intersection network on a biennial basis for congestion management monitoring purposes and for use in corridor planning studies. This information will then be used to identify changes in traffic congestion levels and patterns in the county. It will also be used to evaluate the effectiveness of potential congestion relief and safety measures like addition of bicycle lanes, turn restrictions, and leading pedestrian intervals.

Next step: Countywide

PTV: In addition to congestion management intersection evaluation, what other key applications does VTA and its member agency cities anticipate using PTV Vistro for?
Eugene Maeda: Vistro will also be used by the local cities for intersection analysis and to analyze different traffic impact scenarios of new land use development proposals and major transportation improvement projects. Those are projected to generate 100+ peak hour trips as part of VTA’s Transportation Impact Analysis Guidelines requirements. For consistent analysis and reporting purposes, local jurisdictions are required to explicitly use Vistro to conduct the traffic impact analysis for multiple scenarios, and for evaluating mitigation measures. Examples include evaluation of roundabouts, stop-control devices, and traffic signal timings.
PTV: How does PTV Vistro fit into the broader transportation vision at VTA?
Eugene Maeda: The current traditional practice of congestion management planning involves data collection, developing complex simulation forecast models, conducting corridor studies to identify improvements, then implementing projects without the benefit of understanding the operational effects at the county region level.
The vision for VTA is to use PTV Vistro as a first step effort in developing a countywide urban mobility platform in PTV Visum software that includes all 2,000+ signalized intersections with current signal timing plans in Santa Clara County. PTV Visum and Vistro will allow traffic engineers and transportation planners to evaluate the effectiveness of different mobility options at the operations level using big data, as well as the ability to analyze green-house gas emissions and estimated vehicle miles traveled. The information from Visum can then be used to communicate and assist VTA Board of Directors and local decision makers in choosing a preferred scenario with a list of projects for implementation, and later be used to monitor the effectiveness of the projects as they are completed.
