Creating a more livable urban environment is on the plate of many cities worldwide. In terms of mobility, this opens lots of challenges.
On the one hand, cities must guarantee that people get from A to B in a comfortable, safe, and affordable way. On the other hand, they need to consider economic and environmental aspects. Also, new mobility offerings and services are constantly affecting the transportation landscape.
So to shape future mobility, cities need to understand their entire, complex mobility ecosystems. This is where big data analysis and visualization play a key role.
Even politicians have recognized that big data is critical transportation planning. German Chancellor Angela Merkel recently announced a plan to set up a “Mobility Data Room” for Europe. It will collect real-time data from various sources: the automotive industry, public transport, and new mobility providers.
Smart use of data offers many possibilities in understanding, managing, and regulating mobility.
Evaluating infrastructure
[ultimate_video u_video_url=”https://www.youtube.com/watch?v=ao2d-1-wVM4″ yt_autoplay=”” yt_sugg_video=”” yt_mute_control=”” yt_modest_branding=”” yt_privacy_mode=”” play_size=”75″ enable_sub_bar=””]
Data-driven analysis helps evaluate existing infrastructure, and examine what-if scenarios: What is the travel demand during different times of day? What is the capacity of a public transport system? Are there bottlenecks? Will new mobility modes improve services in an existing transport network.
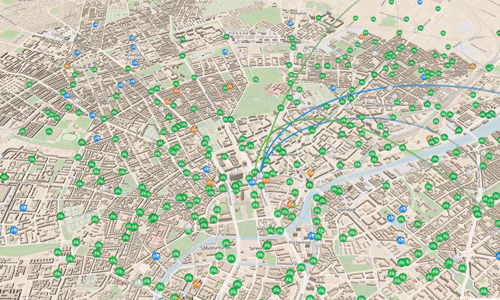
Be it specific roads, neighborhoods, or even entire regions – so-called heat maps can illustrate the traffic volume across the entire route network and highlight hot spots. Such visualizations enable traffic planners to identify where the potential for optimizing the infrastructure is.
Implementing regulatory measures
With the help of big data analysis and visualization, policymakers can also immediately test and evaluate the implementation of regulatory measures: Will a new congestion charge reduce traffic in the city center? How can bans on passage or parking be implemented? Where should an emission-free zone be best established?
Visualizations on a digital map support the decision-making process – for example by enabling transparent and comprehensive communication between stakeholders and the public. This makes it easier to collect feedback, discuss alternatives, and provides a solid basis for implementation of traffic measures.
Planning new mobility offers
Another field in which big data analysis can help is the planning and operation of new mobility services.
With an ever-growing number of new mobility solutions enriching the range of transportation services, it’s up to the cities to take the lead. Only with the appropriate framework, new services will effectively complement existing mobility offerings and benefit the citizens and the environment.
Data analytics enable cities to evaluate in advance the effects, chances, and risks: Is another e-scooter provider needed? What are the best locations for docking-stations? Which operating area would be suitable for a new bike sharing service? In which areas should car-pool services, such as Uber, be allowed to operate?

If cities address these questions and challenges, they can provide the framework for attractive and successful mobility measures.
Data is also an important source of information for fleet operators planning to offer new mobility services. It allows them to evaluate the best conditions to make their business model work. For example: What is the expected demand for the service? How many passengers and vehicles would be needed to meet this demand in the most economical way?
Big data analysis and visualization tools are the key to building up smart and future-proof mobility policies. They offer transparency and enable city and traffic planners to make strategic and operative decisions based on verifiable facts.


