Accessibility analysis is a powerful tool to understand and improve people’s mobility in cities and regions. In recent years, more mobility planners are including accessibility analysis in their work, using the latest technology.
Fortunately, there is a growing number of digital tools available for conducting reliable accessibility analysis.
Here’s a short guide to accessibility and how it can be deployed to improve mobility.
What is accessibility?

Access to mobility means access to society: education, jobs, leisure, and so much more.
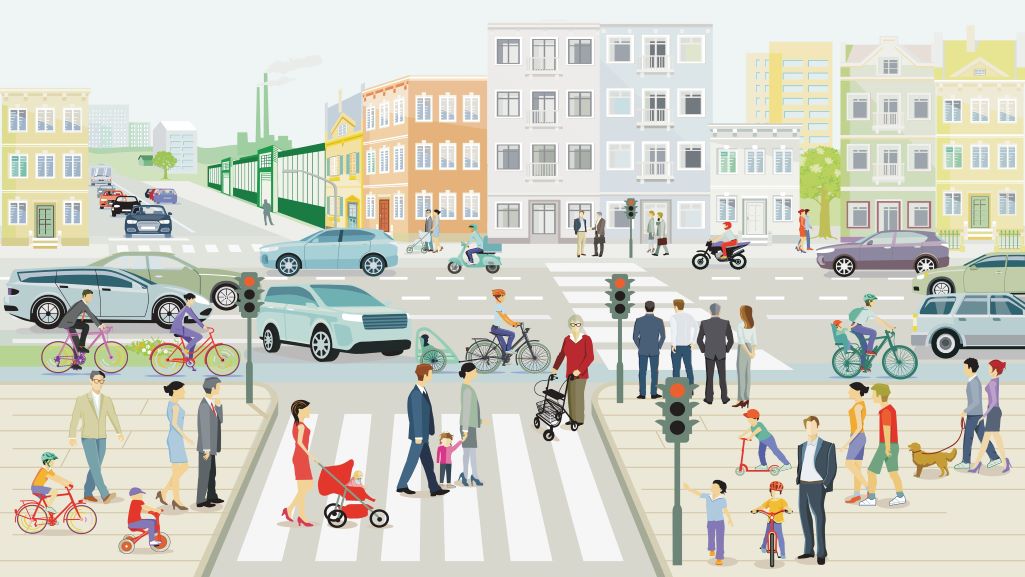
Accessibility is a mobility indicator of the possibilities and limitations for people to move from A to B. That means, how they can reach places of employment and education, parks, and other destinations, by all means of transport – walking, public transit, private vehicles, or cycling.
Instead of predicting what people will do, accessibility measures what they can do. This information helps to understand the existing mobility systems and can be used to compare the impacts of projects and changes.
In other words, accessibility is a powerful indicator of how well a mobility system is serving a community. Improving accessibility empowers people to move forward.
What is an accessibility analysis?
The accessibility of locations is an indicator when assessing or evaluating mobility concepts. Therefore, accessibility analysis is an important instrument in transport planning, provision of public services, and location planning, evaluation, and optimization.
Why should planners, especially mobility planners, include accessibility analysis in their projects?
According to Klaus Noekel, a senior mobility expert at PTV Group, “it’s necessary to understand the desired activities of people and their locations, and to measure how easily these locations can be accessed. Accessibility is all about that, and it forms the basis of all useful transportation planning”.

How is accessibility measured?

There are different indicators that define accessibility, depending on the use case. For example, to analyze the accessibility of a planned kindergarten, it is more relevant to measure walking times for children in the vicinity. But when planning a logistics distribution center, it is more important to measure travel times for trucks or for the recipients of the goods.
When the metrics of an accessibility analysis are visualized, planners get an additional perspective for considering connectivity, especially for biking, walking, and transit. This helps them understand the transportation situation.
Accessibility data with high spatial resolution clearly show areas where mobility provision does not match mobility needs, e.g., which are underserved by public transport. As a result, it is possible to quantify the improvements and investments needed.
By analyzing land use, road infrastructure, traffic stress, and transit schedules, stakeholders can analyze the mobility networks and how they enable people to travel to various destinations. This gives planners an understanding of what works, and of barriers to better connectivity.
Accessibility analysis with software tools
Software is of course needed for an effective and data-based accessibility analysis. Such software should be based on accurate data and consider all modes of mobility – including walking and cycling.
The computing of accessibility measures is like running a database or GIS query against a large database of possible destinations (POIs) and against a representation of the transportation supply (network, timetables). While this can be done with a generic database or GIS software, a dedicated transportation modelling software adds just the right data structures.

A modeling software should also offer super-efficient implementations for finding the best travel times for each mode, between many thousands of origins and destinations.
Take for example PTV Model2Go, a technology to automate the building of transport models that supplements the world-leading transport planning system PTV Visum. Users of PTV Model2Go can now jump-start their accessibility planning in any region of the world.
Mobility models created with PTV Model2Go contain the required mobility supply data and spatial structural data. Together with PTV Visum, users benefit from a powerful tool, which enables them to specify the right accessibility indicators for their respective use case.
“PTV Visum software is a particularly well-suited choice of software to perform accessibility calculations and to build and store the underlying transport models”, says Noekel.
Another software tool for analyzing accessibility is PTV Access. This free online tool measures how accessible cities are (currently available for all major cities in Germany). Users can focus on several mobility modes and see how well the residents of a city are served. It is also possible to use PTV Access to compare between cities.
Mobility planners and accessibility analysis

Accessibility, and accessibility analysis, is becoming an integral part of the work done by mobility and urban planners.
But until now, says Noekel, “Many transport systems look, as if they were optimized for cost-effective operations, no matter what this means for practical usability”.
He suggests that planners think from the person perspective: “The focus should be more on what people really need to support their daily living, and how we can provide the necessary mobility, preferably in a cost-effective way”.
Related Posts


