
Table of contents
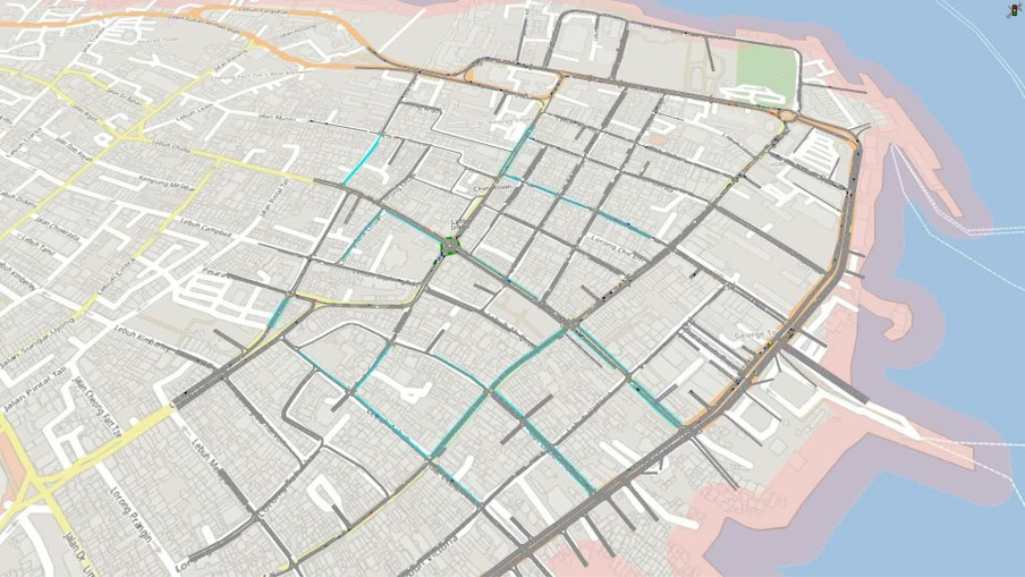
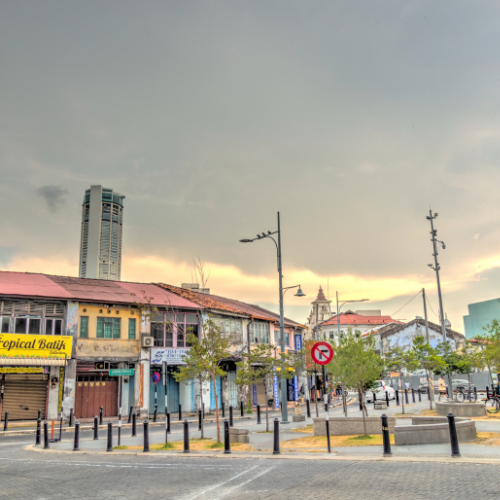
Many cities are under pressure to manage growing travel demand within historic, space‑constrained environments. Penang, Malaysia, is one of them: a region of 1.8 million people where Georgetown’s UNESCO World Heritage center combines dense streets, heritage limitations, and highly dynamic mobility patterns. To understand these conditions and test improvements before implementation, we turned to urban mobility microsimulation using PTV Vissim.
When I joined the effort through the ASEAN Australia Smart Cities Trust Fund (AASCTF) Penang Smart Mobility Micro-Simulation Model Development program. Our mandate was clear: build a calibrated PTV Vissim model of Georgetown’s core so that Digital Penang and the Penang Island City Council (MBPP) could confidently evaluate current and future mobility strategies.
In this article, I walk through how the model was created, how four policy scenarios were assessed, and how the results informed real decisions for one of Southeast Asia’s most complex urban environments. I also highlight tips for planners facing similar challenges in other cities.
Urban mobility microsimulation: Project background and stages
Our priority was creating a robust, reusable base model of Georgetown’s historic city center. With this model, authorities could assess developer proposals and test policies and designs, including parking reduction, bus priority, micro‑mobility, and car‑free streets. They could also communicate impacts to decision‑makers and the public and build internal capacity to improve strategies.
Instead of presenting lists of ideas, I aimed to show quantitatively how each change affected the network.
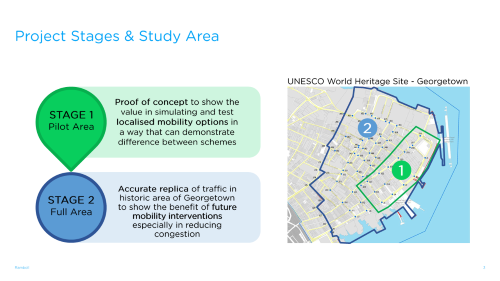
I began with a pilot area – a proof of concept – to demonstrate the value of micro simulation for localized options and to highlight the differences between schemes.
Then, we expanded to a full-area model of the UNESCO World Heritage Site in Georgetown. This model faithfully represented traffic conditions and revealed the benefits and trade-offs of different scenarios, especially those related to congestion.
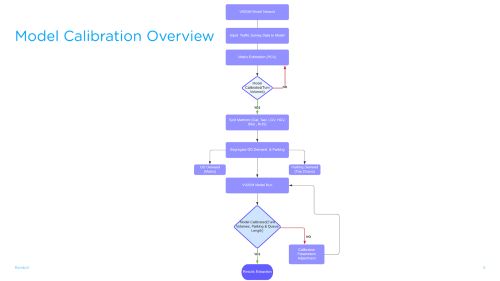
Methodology: Calibrate before drawing conclusions
It was more important to get the foundation right than to rush to scenarios. These steps ensured the model accurately supported urban mobility microsimulation of Georgetown’s constrained street network:
- Calibration targets: Turn volumes, parking performance, and queue lengths were iteratively matched. Only then did we progress to scenarios.
- Data and network: We expanded the network to Stage 2 and conducted additional traffic and movement counts.
- Demand and supply: I ran a PCU matrix estimation, then split it by vehicle class (car, taxi, LGV, HGV, bike, and bus) and segregated origin-destination (OD) demand versus parking demand.
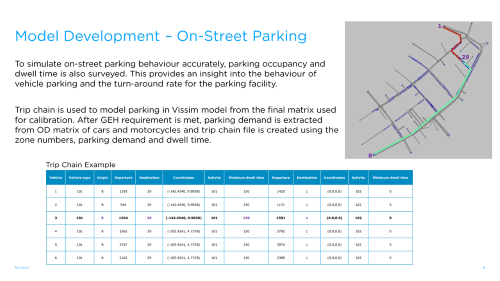
- Parking realism: Since on-street parking is a key factor in Georgetown’s traffic conditions, we surveyed parking occupancy and dwell times. We then used trip chains to reproduce turnover behavior in Vissim, but only after meeting GEH targets in calibration.
What we tested – and why
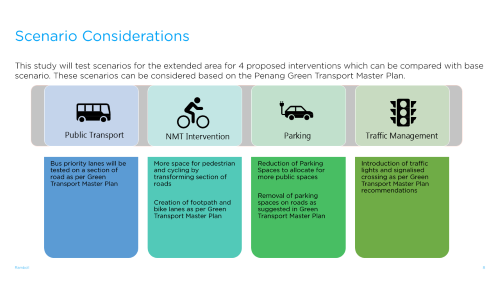
Using this calibrated base, we applied urban mobility microsimulation to assess the following four policy scenarios from the Penang Green Transport Master Plan. We then compared these interventions against the calibrated baseline.
1. Public Transport Priority: A bus lane on a key corridor without signal priority.
2. Pedestrian and cyclist priority: Conversion of selected streets to non-motorized transportation (NMT), with new footpaths and possible bike lanes.
3. Parking Reduction: Targeted removal of on-street parking spaces that impede buses and NMT.
4. Traffic Management: Two signalized crossings to the ferry terminal and two new signalized junctions will improve circulation.
What the calibrated model showed
Network‑wide indicators
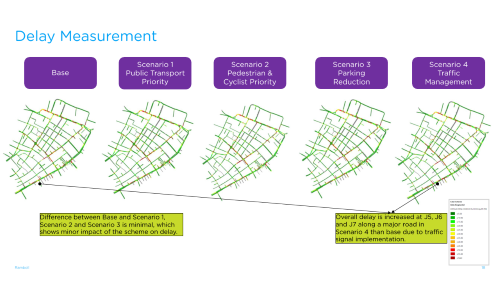
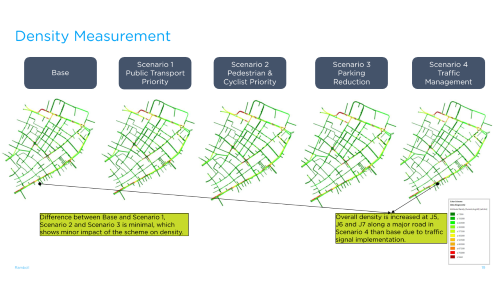
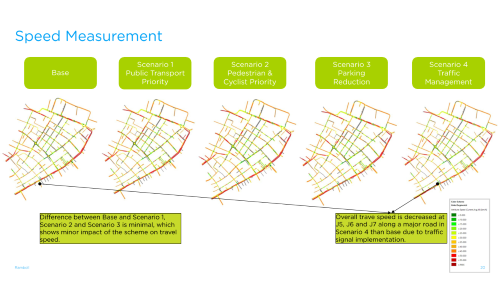
We compared each scenario to the base using Vissim outputs for delay, density, and speed.
For scenarios 1-3, the network-wide differences were generally small and consistent with the maps. Scenario 4 produced localized increases in delay and density (as well as lower speeds) near the new signals, which is an expected outcome when adding protected crossing time to a tight urban cycle.
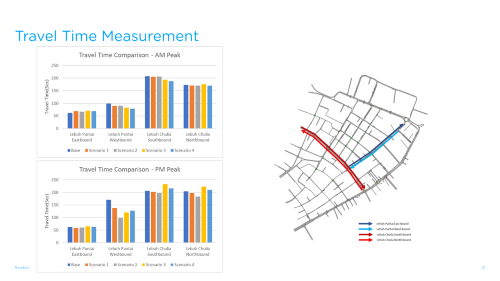
Travel‑time corridors
We tracked directional travel times on key corridors during the morning and afternoon commutes (AM and PM peaks). The results varied by corridor and intervention. Rather than cherry-picking a single link, we used the results to cross-check the network KPIs.
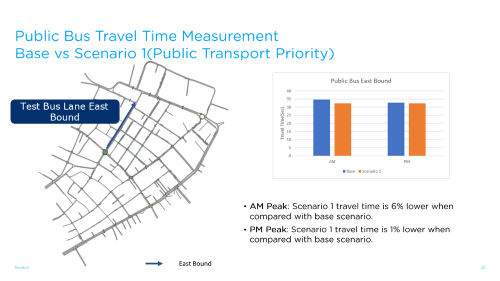
Bus lane performance (Scenario 1)
On the eastbound test segment, the dedicated bus lane reduced public transit travel time by approximately 6% during the AM peak and 1% during the PM peak compared to the baseline.
Even modest percentage gains can be operationally significant for maintaining schedules on short urban routes.
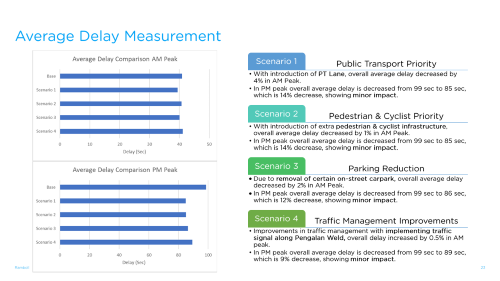
Average delay (all scenarios)
From the network averages:
- Scenario 1 (PT lane): -4% AM, -14% PM (99s → 85s).
- Scenario 2 (pedestrian/cycle): -1% AM, -14% PM (99s → 85s).
- Scenario 3 (parking reduction): -2% AM, -12% PM (99s → 86s).
- Scenario 4 (Signals): +0.5% AM, -9% PM (99s → 89s).
These averages temper expectations. Visibility and safety benefits (e.g., safer crossings) may introduce minor AM costs in Scenario 4, while PM benefits remain substantial.
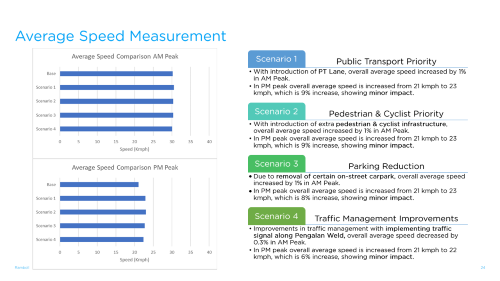
Average speed (all scenarios)
Network-wide average speeds:
- Scenario 1: +1% AM; +9% PM (21 to 23 km/h).
- Scenario 2: +1% AM; +9% PM.
- Scenario 3: +1% AM; +8% PM.
- Scenario 4: -0.3% AM; +6% PM (21 → 22 km/h).
Scenario 4 again shows the expected AM trade-off where pedestrian priority is added, with a PM recovery.
Engaging stakeholders
How the results were used was equally important. The animations produced through urban mobility microsimulation helped me transform abstract network effects into a shared visual language for council officers, developers, business groups, and residents.
When people could see queues forming and clearing, buses moving in the dedicated lane, or how a crossing reallocated time directly from the micro-simulation model, the discussions shifted from opinions to outcomes.
That’s how we achieved alignment on where and how to make changes.
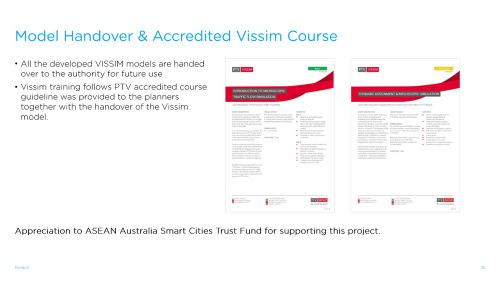
Handover and capability building
To ensure long-term value, we did more than just hand over the base year and scenario models to the authority. I also provided PTV-accredited training, covering Vissim fundamentals and advanced topics such as dynamic assignment and mesoscopic simulation.
As a result, local planners can now maintain and extend the model with confidence for future tasks.
We concluded with a Sustainment Action Plan so that the model would remain a living asset rather than a one-off study.
This project shows how urban mobility microsimulation helps heritage cities reduce risk and make informed mobility decisions.
My tips for planners
1. Calibrate for the decisions you must make. Include parking turnover and dwell time if curb use affects operations. The trip chain approach was decisive in Georgetown.
2. Localize expectations. Network averages may show small percentage shifts, but corridor or user group gains (e.g., buses or pedestrians) may be the policy target. Report both.
3. Use visual evidence to manage trade-offs. Adding protected crossings comes at a cost. Showing the “why” and the “where” turns controversy into design iteration.
4. Embed capacity. Training and a sustainment plan transform the model into a platform for daily planning, development control, and public communication.
Closing thought
For a heritage city that still needs to move, calibrated micro simulation in PTV Vissim provided the evidence needed to validate designs and phases of implementation, as well as to bring stakeholders along on the journey. The goal is not to prove a point, but rather to reduce risk before implementing changes.
As a result of the project, MBBP (Penang Island City Council) is willing to continue using PTV Vissim for future traffic studies.

Explore Traffic Simulation Solutions
See how traffic simulation helps cities test scenarios, improve mobility, and make informed decisions – including in historic sites
Explore Traffic Simulation Solutions
See how traffic simulation helps cities test scenarios, improve mobility, and make informed decisions – including in historic sites
Related Posts


