In many ways, Covid has spurred discussion about how we want to live in the future. Lockdown measures have shown how positively less congestion and noise affect quality of life, and how the cityscape changes with more public space for pedestrians, bicycles, café terrasses, etc. Experts agree that a citizen-centered focus is needed and street space needs to be reallocated in our cities. This applies especially to mobility.
To a large extent, the model of the car-centric city that prevailed for decades is still in effect today. Transportation networks are designed to make it as easy and convenient as possible for car drivers to get from A to B. We are so used to constant car traffic, traffic jams and parked-up streets that we no longer even notice how much road space cars actually take up in our cities.
The average private car is parked for more than 23 hours a day – not only in the garage at home, but often at the curbside. When they are moved, private vehicles are occupied by 1.5 people on average. When we look at the space required, a car at a standstill takes up 13,5 square meters of space per person, compared to only 1,2 square meters per person for a bus at 40 percent occupancy.
Road space needed
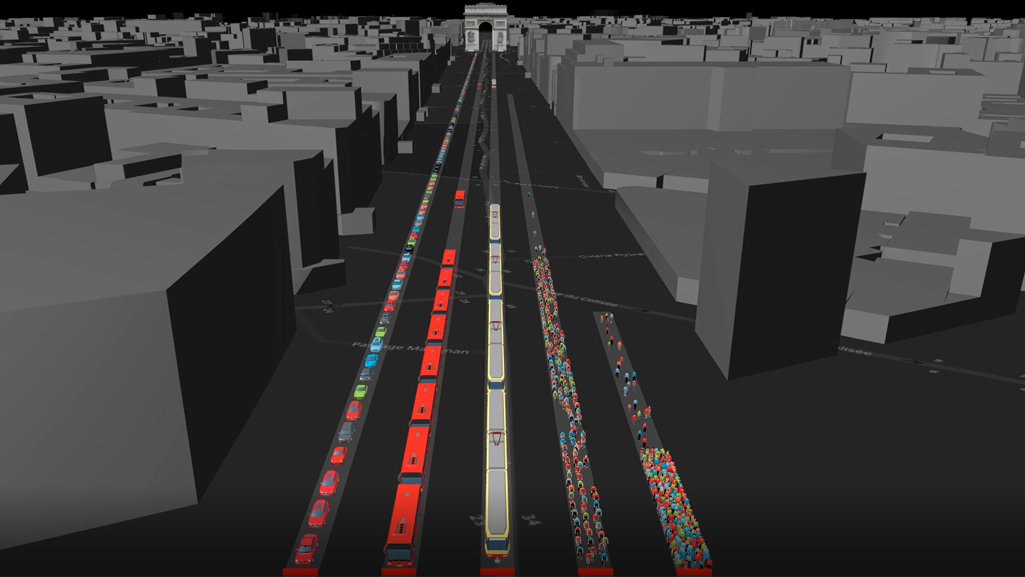
Such numbers are impressive, but also kind of hard to imagine, right? To visualize how the road space needed differs by mode of transport, we created an animation in PTV Vissim and Viswalk.
It shows 200 people each pass through a traffic light in different ways, which means
- An average of 1,5 people in 133 private cars
- 20 passengers in 10 buses
- 40 passengers in 5 trams
- 200 cyclists
- 200 pedestrians
The road has the same width for all means of transport – 3.50 m. Everyone starts moving at the same time. How does the different space requirements in combination with the different maximum speeds and acceleration capacities affect the traffic flow? Which group is fastest?
Placed side by side, it becomes clear how much road space the various modes of transportation require. While cars line up for more than a kilometer to carry 200 people, the tram’s queue is just 197 meters long, that of buses 134 meters and that of bicycles 115 meters. The pedestrians gather on a distance of about 28 meters.
And how fast do they cross the finish line? Buses and trams take just around 30 seconds, followed by pedestrians (about 40 seconds). For cyclists, it takes a little longer to get everyone started, almost 2 minutes. And the cars? It takes more than 4 minutes to break up the long queue.
This shows not only that the car with its average occupancy rate is significantly more inefficient than other means of transport, but also what most commuters experience every day on congested roads: The high space requirement of one person in the car in dense urban space means that the former strength of the car often no longer comes into play which is reaching the destination comfortably and, above all, quickly.
It’s becoming clear that in order to relieve traffic congestion and achieve more sustainable mobility, public transport and active means of transportation must become even more attractive. In this context, reallocating street space place a major role – by the way a topic, simulation also can help with.
Related Posts


Dear Stefanie;
I read the one of your article which has a title “Simulation: How much road space do cars take?” It was really impressive. I read it with attentively. I would like to ask if you have any other article on comparison of time x space amount of transport from A to B with car, tram, bus, bike and walking.
Best Regards
Why did you choose to use 40% occupancy? Is that a convention that is common? Or would average ridership be able to be plugged into this to determine what the space requirements would be for a specific location?