There are many factors involved in redesigning a public transport network. This article examines these factors and how PTV Lines software addresses them.
In public transport network redesigns, regularly optimizing services to fit the operational budget is a crucial factor. These redesigns aim to maintain high service quality in urban areas while aligning services with budget constraints. They may involve adjusting existing services or introducing new ones to efficiently and affordably meet changing demand and improve accessibility.
Public feedback and involvement are critical factors in successful public transport network redesigns, ensuring that the final plans align with the needs and expectations of both the community and key stakeholders. Practitioners use PTV Lines to transform feedback on accessibility and connectivity to draft improved service plans that address community concerns and preferences.
Choosing the right measures while balancing service quality, ridership, and costs is one of the biggest challenges for public transit planners.
Use of software for public transport redesign

Public transport redesigns, or changes to an existing transit system, are often resource-intensive to analyze. Any changes to the system impact many commuters, cost, and ridership. Successful redesigns must evaluate many different scenarios efficiently to optimize the outcomes. Planners utilize software tools to help them evaluate many alternatives to optimize Public Transport redesigns. One such tool is PTV Lines.
Developed by PTV Group, PTV Lines is a cloud-based software for optimizing public transport services. It does not require expert knowledge of complex multimodal planning tools or transport modeling. Planners can use PTV Lines for network and timetable planning, evaluating service indicators, assessing operating costs and conducting public transport demand analysis.
The software provides in-depth analysis to help transit agencies improve service and meet passenger demand and visualizations to guide stakeholder discussions. Additionally, it integrates with PTV Visum with seamless data exchange to modify public transport components in multi-discipline transport planning.
Let’s look at the key challenges of public network redesign and see how the software can address them.
Balancing resources and level of services
Challenge: How do you efficiently optimize service quality, budget constraints, and vehicle availability? How do you adapt routes to provide equitable and adequate service in dynamic political environments and evolving neighborhoods? Practitioners need planning tools to quickly test ideas and provide key service metrics for smart scenario comparisons. Conceptual tools evaluate services to new housing developments, shifting population densities, and infrastructure projects with sketch routes and schedules.
Solution with PTV Lines:
- Sketch line feature: This tool allows planners to draw suggested routes on a map that automatically match to roads and respect driving restrictions, simplifying the process of designing efficient routes.
- Sketch-and-Snap: Existing stops are automatically incorporated to create stop sequences, which can be manually adjusted if necessary. This allows planners to create detours with automatically generated stop sequences in minutes.
- Run time calculation: Travel times between stops are calculated based on road types and average speeds, ensuring realistic scheduling.
- Route variants and routing modes: Planners can import existing public transport services to create multiple route variants. The street routing mode aligns the route with the existing streets, whereas PT routing mode creates a route along existing line routes and uses their run times.
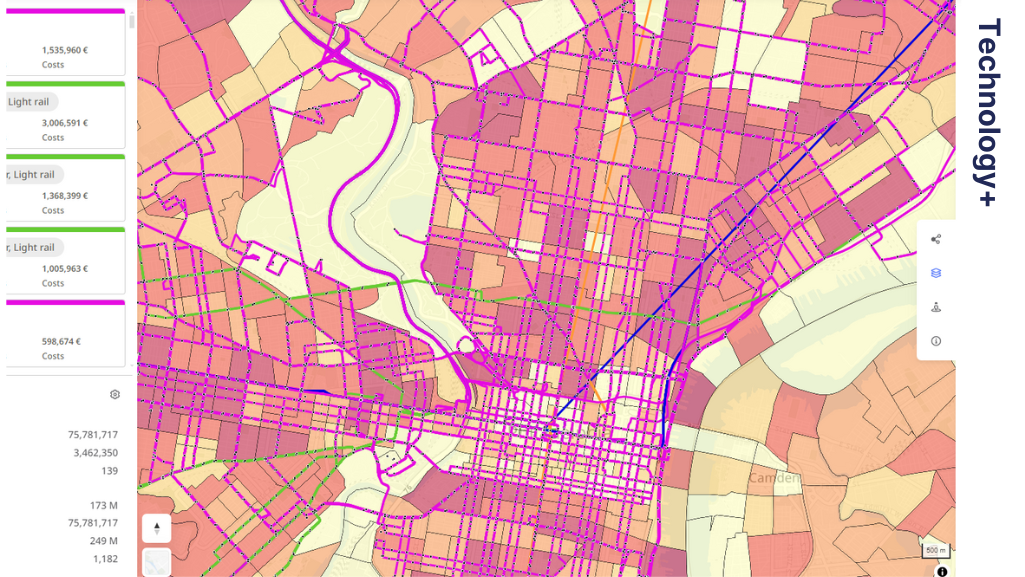
- Catchment area analysis: By setting catchment area radii (e.g. 300m for buses, 800m for metro), planners can analyze the coverage of public transit routes and stops to identify and address service gaps.
Sketch-and-Snap: In PTV Lines, the stop sequence is automatically generated by outlining a route as a cause on the routable map and then allowing manual adjustments to be made.
Dealing with seasonal or short-term changes in service and costs
Challenge: Temporary events such as construction, road closures, and public events require short-term network adjustments to minimize service disruptions.
Solution with PTV Lines:
- Operating Cost Calculation and Variant Comparison: The software calculates the required supply for different service days (e.g. a typical week in August or a Christmas week) and compares different scenarios to find the most efficient detour routes and resource allocations. Planners can customize groups of days for which the schedules are valid, such as Monday-Thursday, Friday, and Saturday-Sunday.
- Cost Allocation: Planners can define different transportation systems and specify cost factors per kilometer and per hour to aid in financial planning and management during detours. The resulting costs are calculated for the specified period and number of days defined in the valid days.

Production Cost Calculation and Variant Comparison: Define valid day groups and calculate the service costs for a week
Ensure accessibility and coverage


Challenge: How do you make public transport network accessible to all residents, especially those who are more dependent on public transport?
Accessibility and catchment area analysis ensures the geographic coverage of the transit network so that all citizens have access to different public transit systems in their neighborhoods. It is crucial to find gaps and be inclusive of those dependent on public transport. When calculating accessibility, users can set specific times to generate isochrones that show how far one can travel using the transit timetable. Optionally, planners can use the socio-economic data to find out how many people live or work within the service area.
Solution with PTV Lines:
- Spatial data integration: Planners can upload spatial socio-economic data such as job locations, population distribution and school placements. This data is critical for tasks such as catchment area analysis and accessibility assessments.
- Accessibility analysis: Planners can define departure or arrival points on a map to assess passenger reachability and accessibility. Impacts on accessibility due to changes to the network and timetable can be observed immediately, helping to understand their impact on service quality.
Optimize timetables and connections
Challenge: How do you improve the overall user experience of your public transport service? How do you reduce waiting and travel times and connections? The lack of intelligent, integrated analysis tools makes timetable improvements impractical. Planners often don’t see the impact of changes on the entire network and connections.
Solution with PTV Lines:
- Timetable visualization and on-the-fly analysis: Planners can view schedules and corresponding lines on a map, modify trips, and see changes immediately.
- Trip distribution: The distribution of trips throughout the day is visualized in the form of bar graphs, allowing patterns and gaps to be identified.
- Connection analysis: Transfer times between lines at stops are displayed in an easy-to-understand manner to ensure passengers have enough time to transfer. Timetables are linked to the view and can easily be customized.
Trip Distribution: In PTV Lines, it’s easy to manage timetable and trip distribution along a day.
Connection Analysis: Connections at stops are analyzed and improved so that passengers have the best transfer options.
Demand vs. service level

Challenge: How to match public transport services to ridership and travel patterns, essential for optimized vehicle planning, improving service quality, and responding to passenger needs. The first step is to understand where people are traveling from and to, and what routes and transfers they prefer.
Solution with PTV Lines:
Origin-destination matrices show where passengers start and end their trips, helping to create efficient routes and schedules that meet actual demand. By mapping the matrices to supply and obtaining results such as passenger miles/kilometers and ridership profiles by route or boarding and alighting information by stop, planners can identify peak travel times and popular routes and improve service quality by adjusting frequencies and capacity to reduce overcrowding and wait times.
Conclusion
Transforming public transport networks presents several challenges: From balancing resources and adapting to changing demographics to managing short-term detours and ensuring accessibility and connectivity.
PTV Lines software provides integrated, data-driven solutions to these challenges, giving planners the tools they need to create efficient, equitable, and adaptable transportation networks.
By harnessing the power of PTV Lines, mobility professionals can ensure that public transport services not only meet today’s demands but are also robust and flexible enough to accommodate future changes and needs.

Related Products
Related Posts


