
Public transport usage is a major issue in most cities. Can bus operators solve declining ridership with advanced software tools? Absolutely yes! Here’s how we – public transport operator Kauno Autobusai – did it using the new PTV Lines software.
Kaunas and its public transport challenges

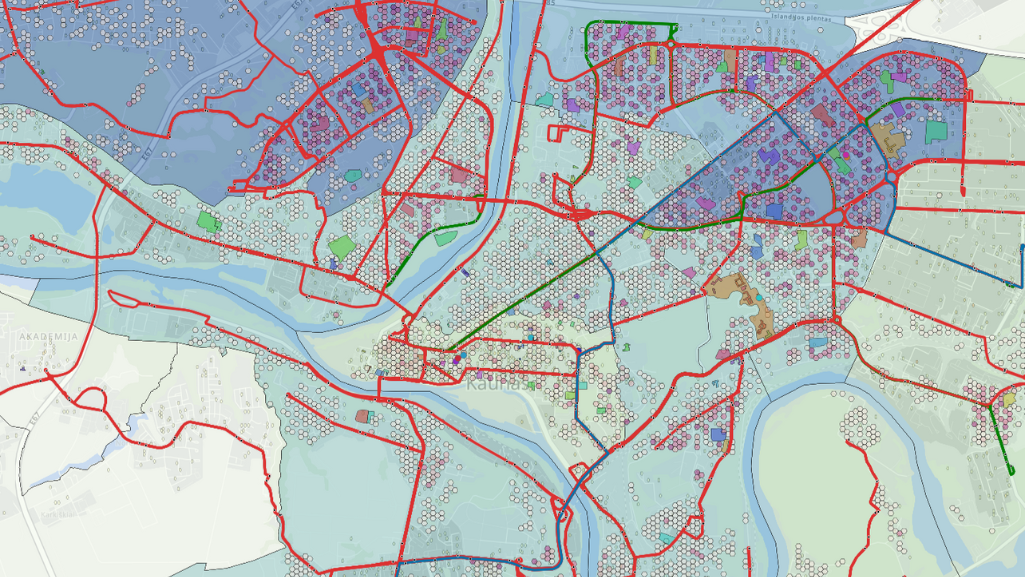
Located at the confluence of the Nemunas and Neris rivers in central Lithuania, Kaunas is the country’s second largest city. It is an important center of industry, transport, science and culture.
The city’s public transport network is based on 51 bus routes and 15 trolleybus routes, managed by local operator Kauno Autobusai.
But Kaunas’s public transport network has been facing serious challenges in the last 30 years. For and foremost, it had to adjust to rapidly changing demographics: The population of the city proper decreased dramatically – from 420,000 inhabitants to 320,000 in 2023. At the same time the suburban population in the Kaunas District rose from 84,000 to more than 100,000.
These changes affected the city’s population distribution and concentration of workplaces. As a result, the number of cars on the roads increased, leading to a dramatic rise in congestion.
At the same time, the number of bus passengers declined, not least because of the old vehicles and inconvenient routes. Even though Kauno Autobusai now operates one of the newest fleets of buses and trolleybuses in Lithuania, it is difficult to convince residents to switch from private cars to public transport.
Selecting a software to improve public transport
Concerned about the environmental impact of increased car use, we at Kauno Autobusai set a goal to raise the number of people using public transport in the city. To achieve this, we needed a reliable tool to analyze the existing bus routes and redesign them to make them more attractive to commuters. The software tool had to be able to create an accurate model of the public transport system without having to invest heavily in additional staff, training and experience.
After market research we chose PTV Lines, the cloud-based public transport line planning and service optimization software. We started with a free PTV Lines demo version, tested it, and soon after started working with the full version.

Analyzing bus routes with PTV Lines

The core of the project is the creation of a digital model of the Kaunas public transport network. It will allow us to make decisions or changes based on the most accurate data.
To build the model, we collect data from various sources and run it in PTV Lines. This allows us to analyze the number of commuters for whom public transport is convenient and accessible.
We focus on analyzing existing bus routes and looking for ways to improve them. PTV Lines helps us understand the origin-destination matrix, or OD matrix, which shows how commuters move around the city. By taking this into account, we can adjust bus routes or create new ones.

PTV Lines helped us to visually identify the main problems in the current route network. Namely, that many of the bus routes overlap in the main streets. For example, in the city center there are 20 different bus routes, and in another main street, Kovo 11-osios, there are 14 different routes.
The large number of routes and the fact that they converge in the city center make it difficult to plan effective timetables and frequencies for these routes. Often, multiple buses arrive at stops within a few minutes of each other, followed by gaps of 10 minutes or more.
With PTV Lines, we can easily track overlapping routes and begin to address these challenges.
Case study: Lines 1 & 46
Let’s see how we used PTV Lines to analyze the routes of trolleybus no. 1 and bus no. 46.
Previously, the two lines shared the same route through the Panemune neighborhood. Both also passed through the central part of the city, where there are already about 20 other bus lines. This resulted in sub-optimal service for commuters.
We wanted to change that. Using PTV Lines, we were able to quickly check different scenarios – and choose the most useful one.


As a result, we adjusted the route of line 46 so that it now only runs to Panemunė. By comparing it with the original route, we knew how many kilometers we had saved and used them to adjust the timetable of line 1. To complete this change, we also rerouted line 46 through other streets to minimize its duplication with other lines.
This example illustrates how quickly we can simulate multiple scenarios with PTV Lines and get an accurate mileage calculation.
Conclusion
The project is currently in the adjustment phase. At present, Kaunas city government is planning infrastructure in Panemune district, and we, Kauno autobusai, are planning various scenarios on how to change the route scheme in the city to make it more convenient and attractive for passengers.


