
Table of contents
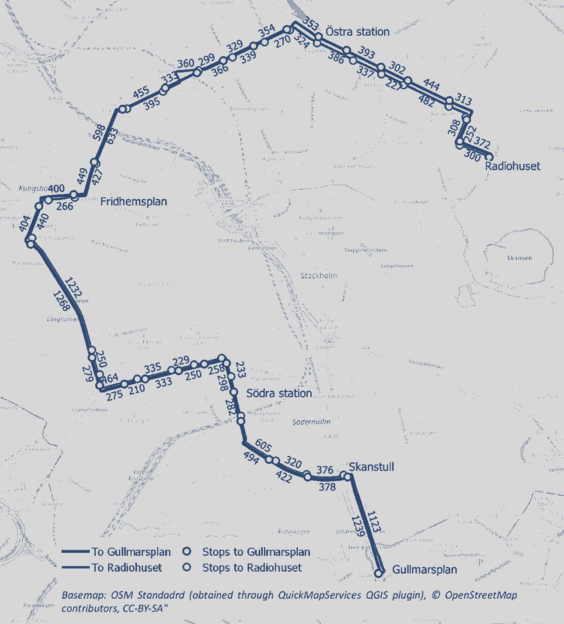
Stockholm’s public transport network is central to the Swedish capital’s mobility strategy, with high-capacity bus lines playing a major role. Among these, bus line 4 stands out as the most heavily used main line in the city center, serving approximately 70,000 passengers per day. Despite its importance, the line struggles with congestion, unpredictable travel times, and overcrowding, making service reliability a challenge.
The operational performance of the current bus service falls short of the targets set by Stockholm’s public transport strategy, which calls for an average speed of 20 km/h, prioritization of bus traffic and improved service reliability.
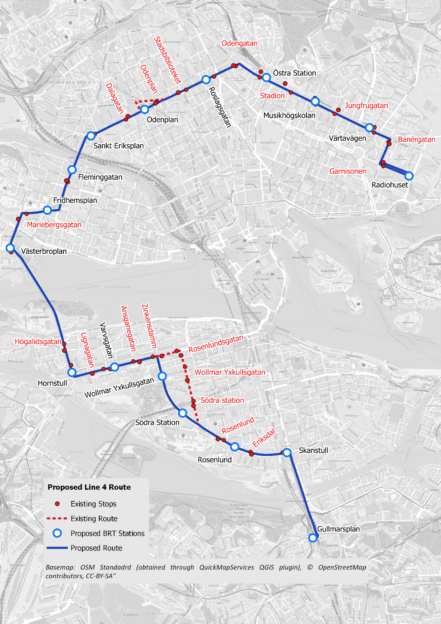
This study, conducted as part of my Master’s thesis at KTH Royal Institute of Technology, investigates the potential of implementing a full Bus Rapid Transit (BRT) corridor along Line 4. The goal was to evaluate how exclusive bus lanes, improved stations and signal priority could improve operations. To do this, I created a detailed microscopic simulation using PTV Vissim and PTV Viswalk, which allowed for an in-depth analysis of both bus movements and passenger flows.
The results showed that BRT improvements could reduce travel times by up to 49%, increase operating speeds by nearly 100%, and significantly improve service reliability. This research provides a data-driven basis for evaluating the feasibility of BRT in high-density cities, and its findings contribute to ongoing discussions about the future of high-capacity bus corridors in Stockholm.
Methodology: Simulation to Evaluate BRT
The study focused on analyzing the quantitative impacts of a full BRT corridor along Line 4, using a microscopic simulation approach. The analysis followed these key steps:
- Scenario Development: Three scenarios were modeled:
- Base Scenario: The existing bus service, operating with mixed traffic conditions, signalized intersections, and current bus stop layouts.
- Scenario 1: A 5-minute headway BRT service, featuring dedicated median bus lanes, off-board fare collection, platform-level boarding, and full signal priority.
- Scenario 2: A 3-minute headway BRT service, testing the feasibility of an even higher frequency system with the same infrastructure.
- Base Scenario: The existing bus service, operating with mixed traffic conditions, signalized intersections, and current bus stop layouts.
- Data Collection & Calibration:
- Real-world operational data from Trafikförvaltningen (Stockholm’s public transport authority) and Keolis (the bus operator) was used to calibrate the Vissim model.
- GPS-based Automatic Vehicle Location (AVL) data was analyzed to match simulated travel times with observed conditions.
- Real-world operational data from Trafikförvaltningen (Stockholm’s public transport authority) and Keolis (the bus operator) was used to calibrate the Vissim model.
- Performance Metrics:
- Travel times and average speeds were evaluated across all scenarios.
- Dwell times, delays, and headway regularity were analyzed to measure service reliability.
- Passenger boarding and alighting processes were simulated using PTV Viswalk.
- Travel times and average speeds were evaluated across all scenarios.
By structuring the study this way, the impact of BRT-specific measures – such as signal priority, improved station design, and exclusive lanes – could be isolated and quantified.
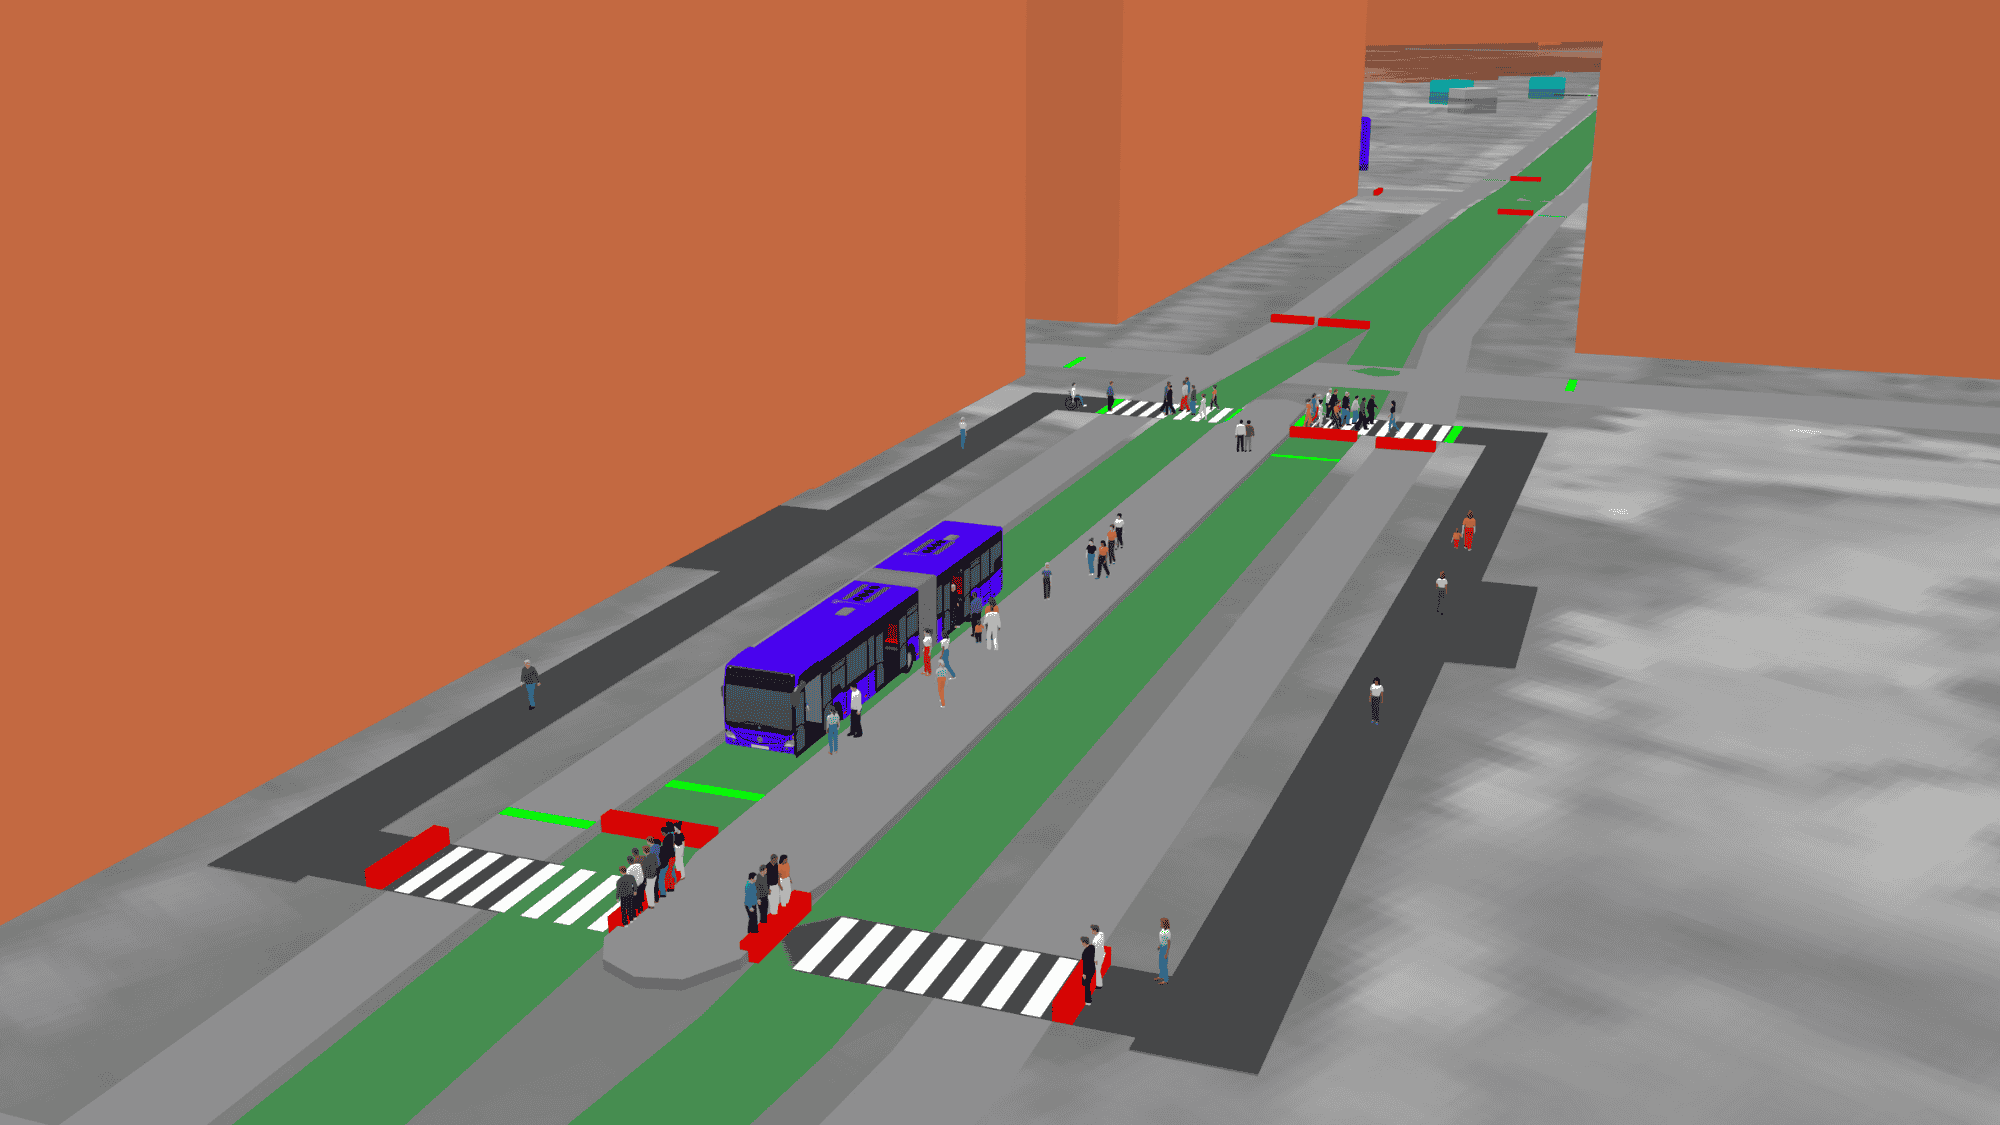
How PTV Vissim and Viswalk Were Used
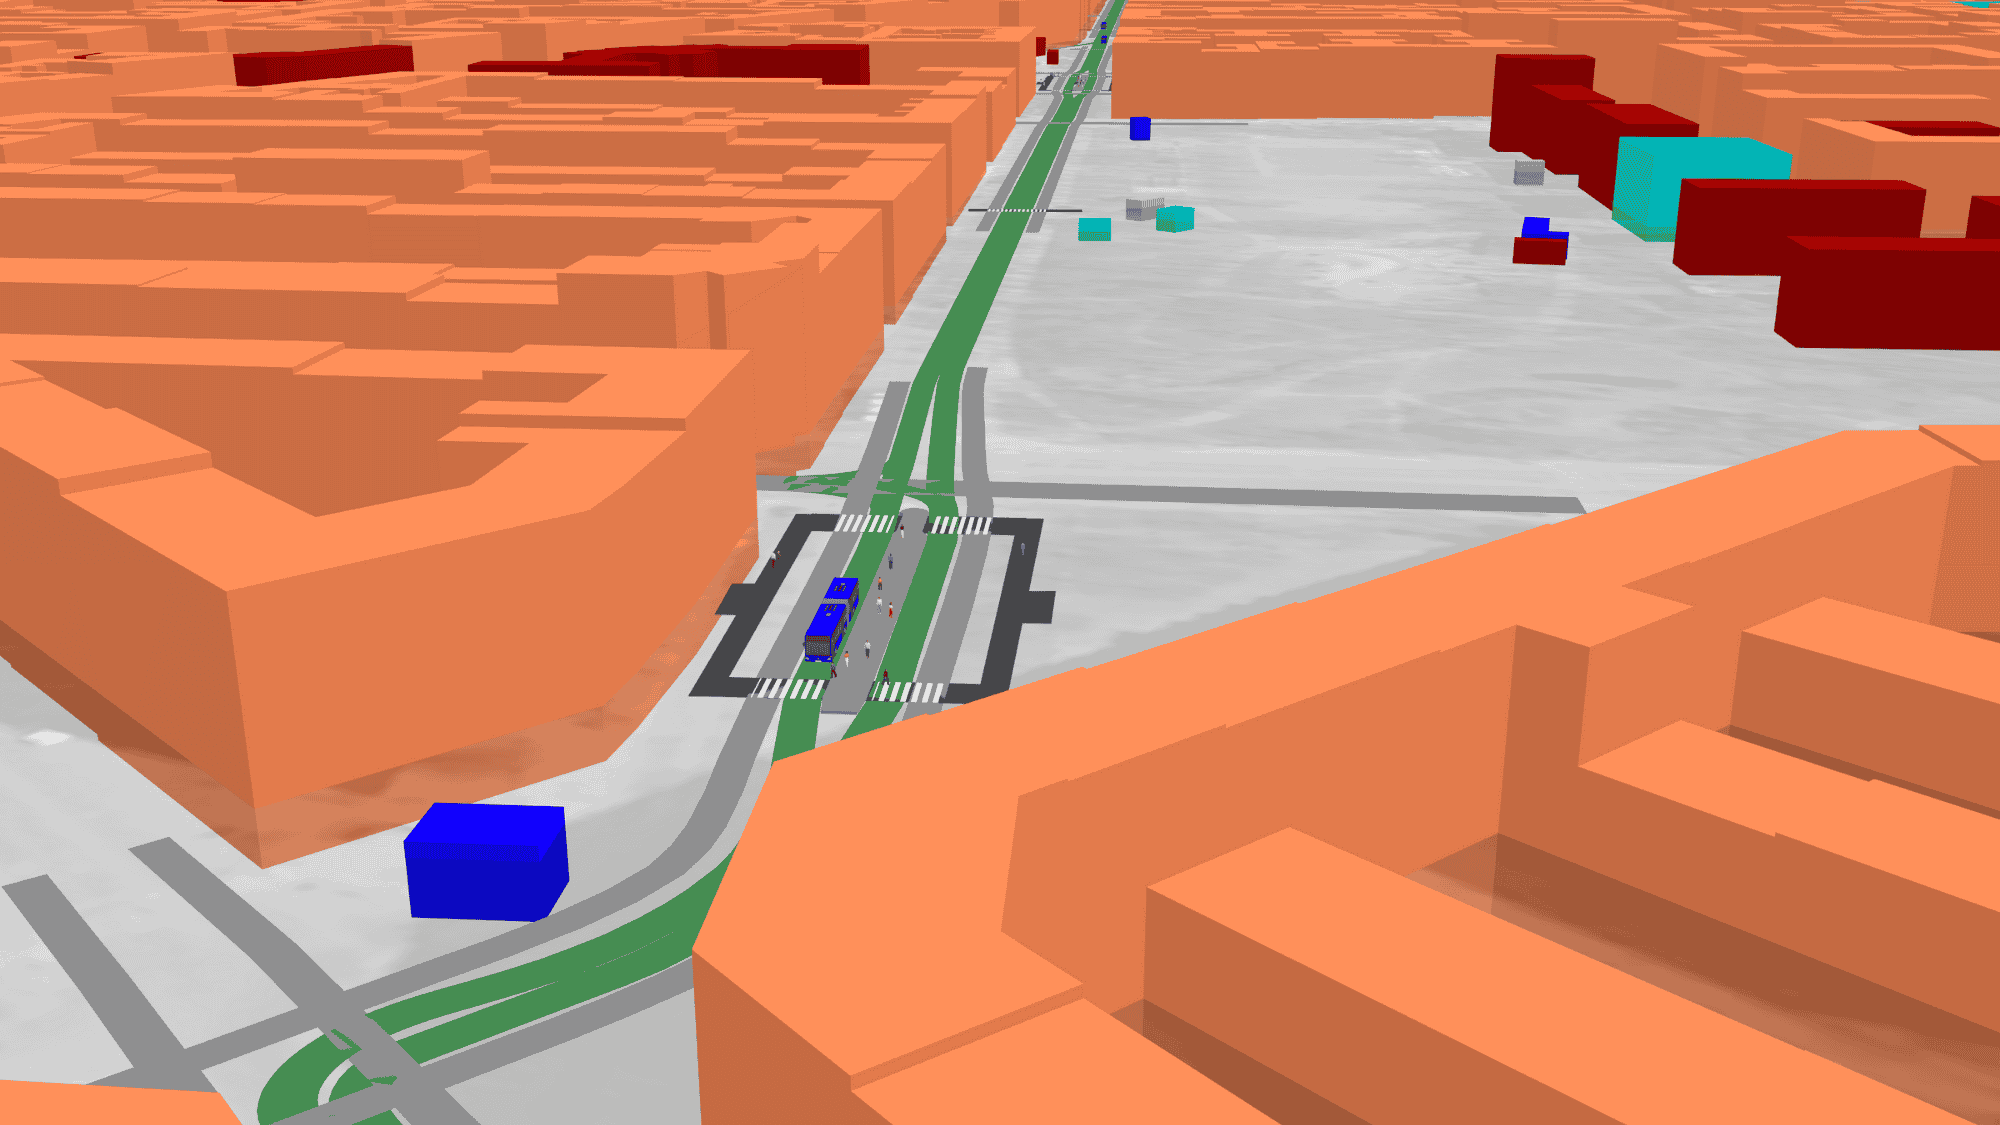
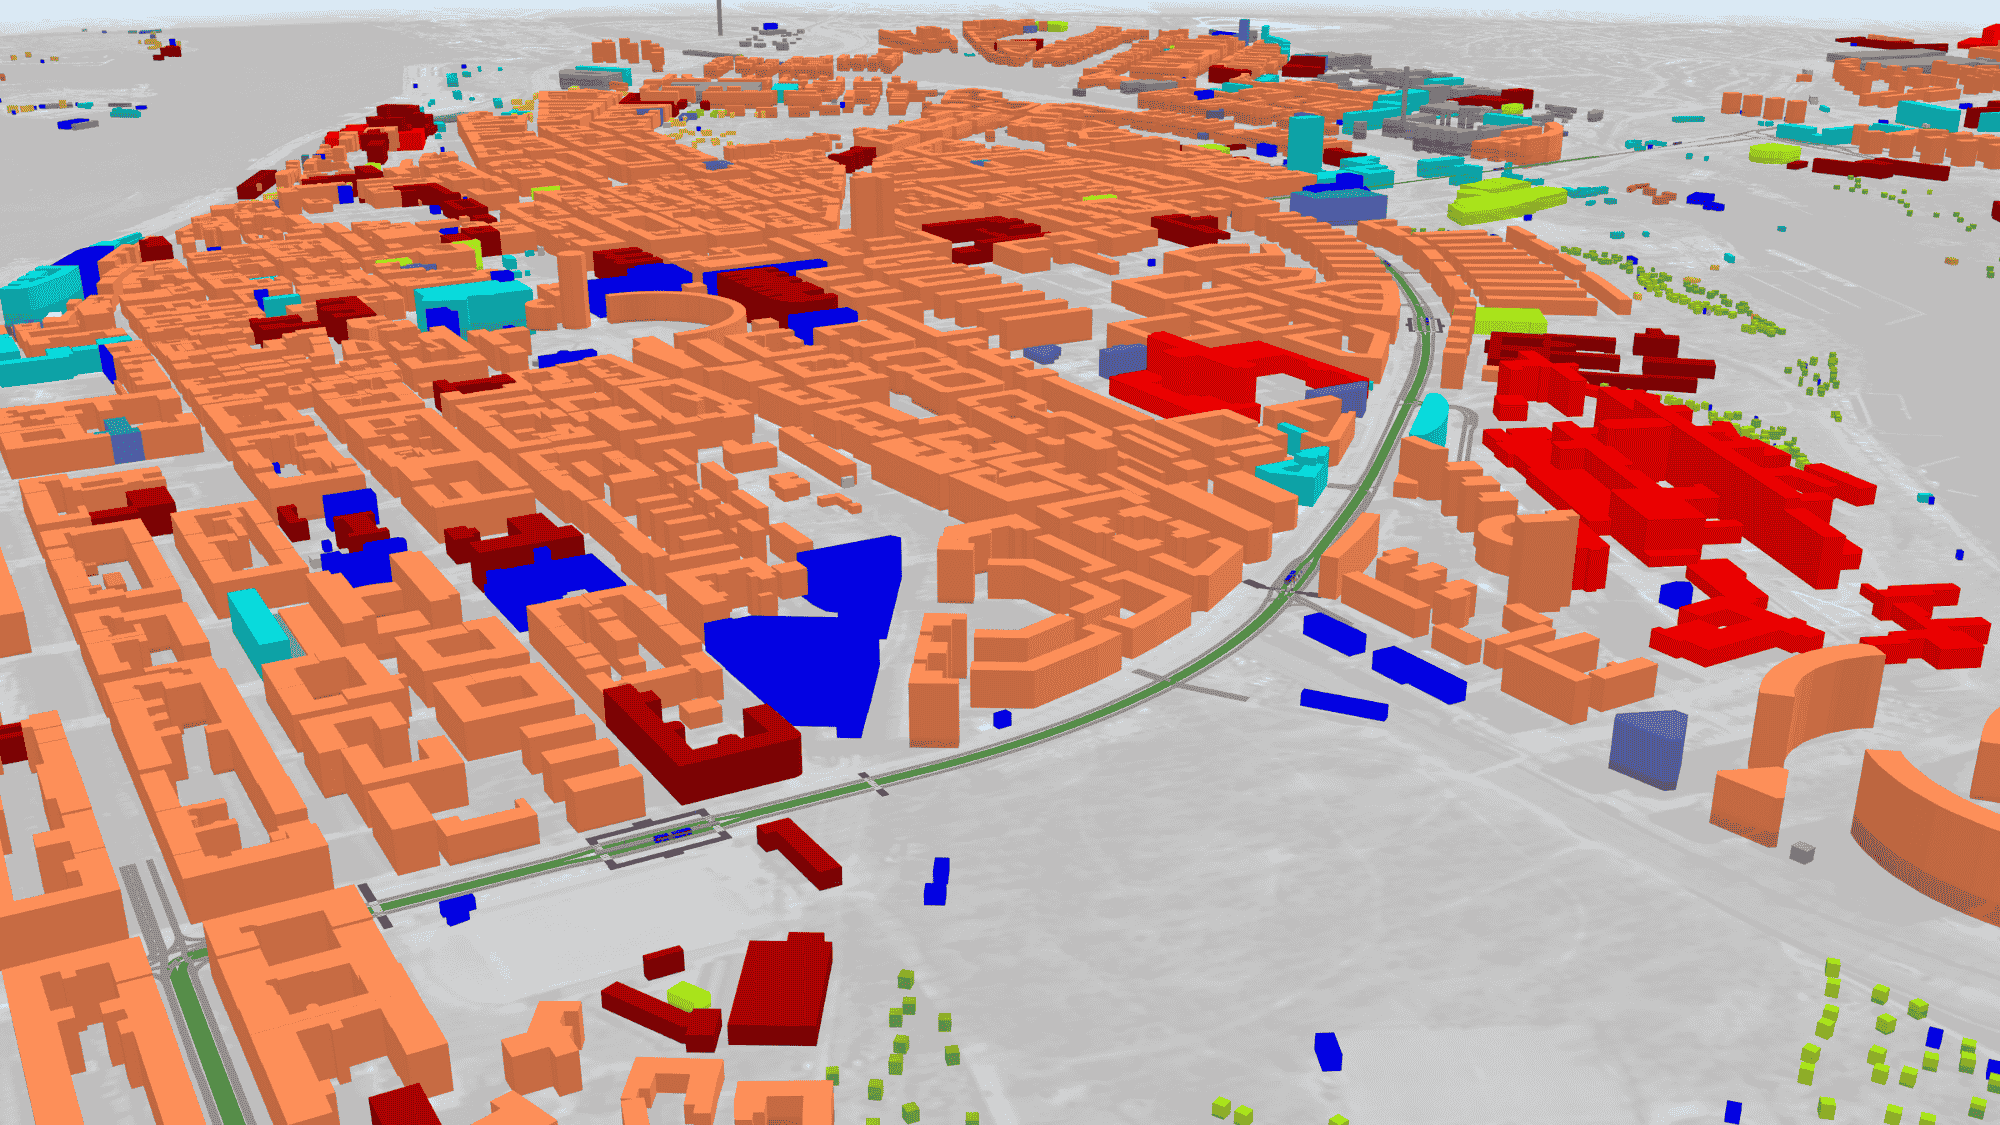
The simulation relied on PTV Vissim to create a detailed microscopic model of Line 4, including the effects of exclusive bus lanes, priority at intersections, and optimized station layouts.
One of the key aspects was the implementation of traffic signal priority. By coding specific signal control logic, the model ensured that buses could move efficiently through intersections without causing significant disruption to general traffic. The analysis also included detailed stop behavior, simulating how buses slow down, stop, and re-enter traffic.
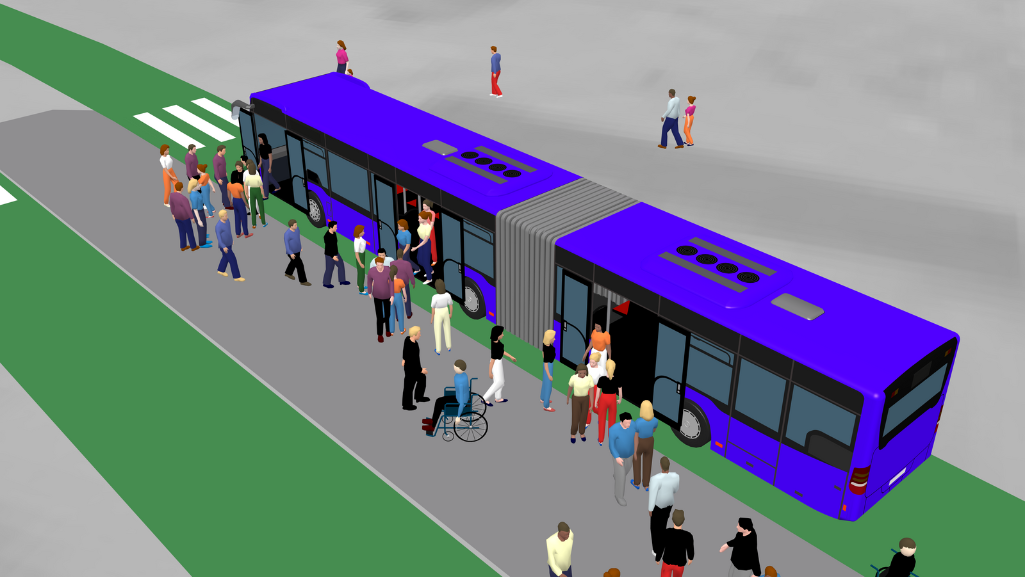
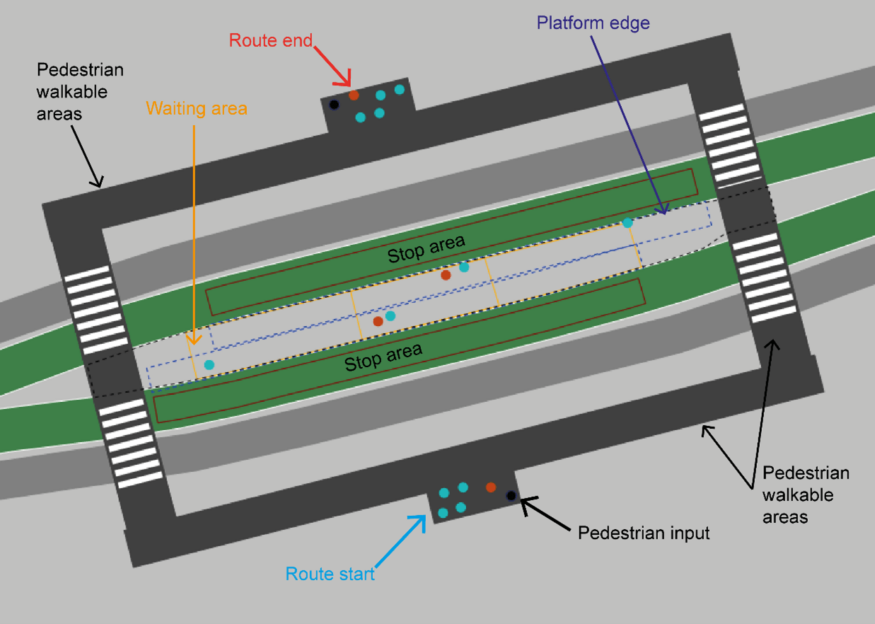
To better understand how station designs would impact operations, pedestrian flow was modeled in PTV Viswalk. The focus was on boarding and alighting times, testing how off-board fare collection and level boarding could reduce delays. The results showed that these measures not only reduced dwell times, but also improved overall reliability by preventing bus bunching.
Key features included in the model were:
- Exclusive BRT lanes: The model tested median-aligned, dedicated bus lanes, improving bus speeds while minimizing conflicts with general traffic.
- Traffic signal priority: BRT buses were given priority at intersections, reducing delays. This was modeled through a VAP logic script, ensuring that priority rules reflected real-world conditions.
- Bus dwell times and vehicle interactions: The stop behavior of buses, including acceleration, deceleration, and queuing effects, was simulated to measure potential bottlenecks.
- Boarding and alighting efficiency: The model simulated off-board fare collection and platform-level boarding, which significantly reduced dwell times compared to the current system.
- Crowding effects: Viswalk was used to identify station layout improvements, ensuring that passengers could board and exit quickly without congestion on platforms.
The simulation results helped identify key sections where additional bus lane expansions or intersection adjustments could further improve performance.
Combining Vissim and Viswalk allowed for a more accurate representation of how a BRT system would function in Stockholm’s urban environment, making it easier to evaluate the feasibility of different operational strategies.
Results: The Impact of BRT on Line 4
The simulation results confirmed that implementing a full BRT corridor would yield substantial improvements in service quality and operational efficiency.
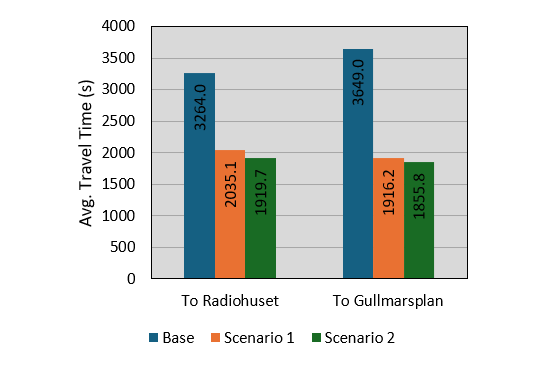
1. Travel Time Reduction: Up to 49% Faster
BRT significantly reduced bus travel times due to dedicated lanes and signal priority:
- Base Scenario: 54–60 minutes per trip.
- Scenario 1 (5-minute headway): 37.6% reduction.
- Scenario 2 (3-minute headway): 49.1% reduction.
This means that a one-hour journey could be shortened to just 30 minutes, making public transport much more competitive with car travel.
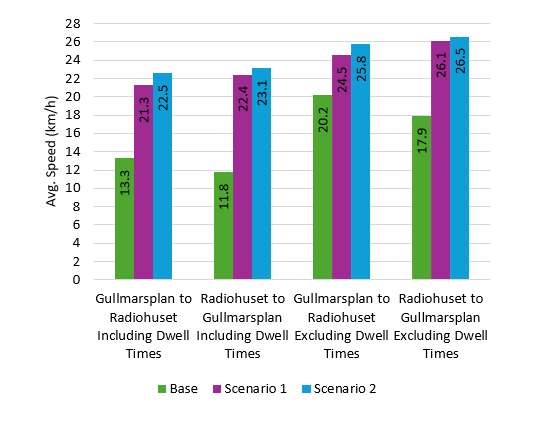
2. Operational Speeds: Nearly 100% Increase
The average speed of buses was more than doubled under BRT conditions:
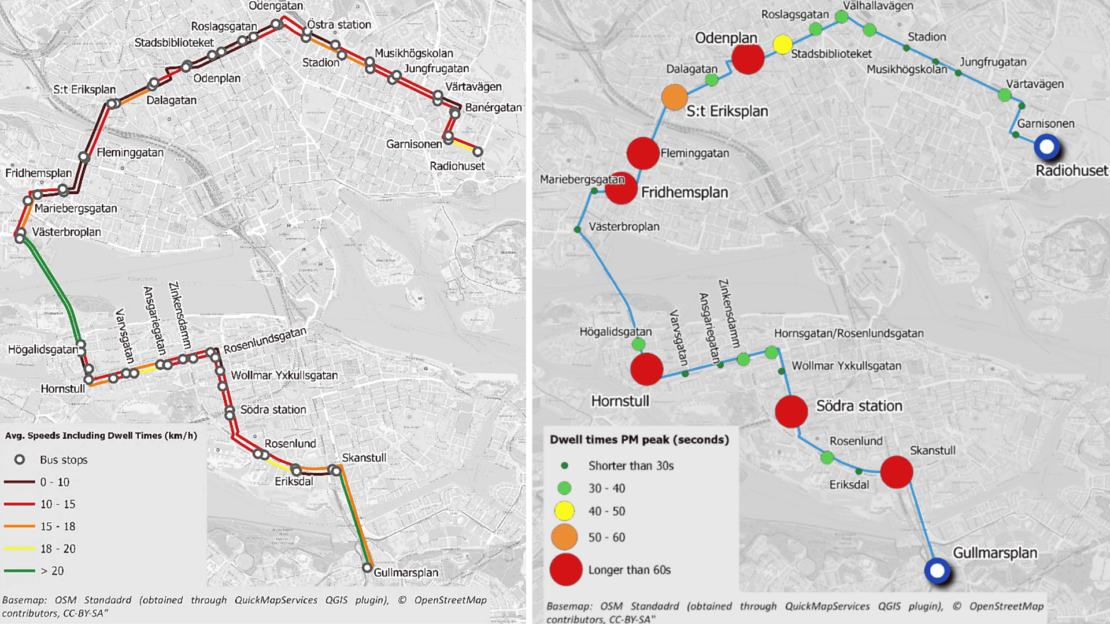
- Base Scenario: 11.8–13.3 km/h.
- Scenario 1: 20.2 km/h.
- Scenario 2: 26.2 km/h.
These improvements align with the city’s target of 20 km/h for trunk bus services.
3. Dwell Time Reduction: Up to 65.6% Less Waiting
With off-board fare collection and platform-level boarding, dwell times at stops were significantly reduced:
- Base Scenario: Average 35-70 seconds per stop.
- BRT Scenarios: Reduced to 15-30 seconds per stop.
Shorter dwell times prevent bus bunching, leading to better service regularity.
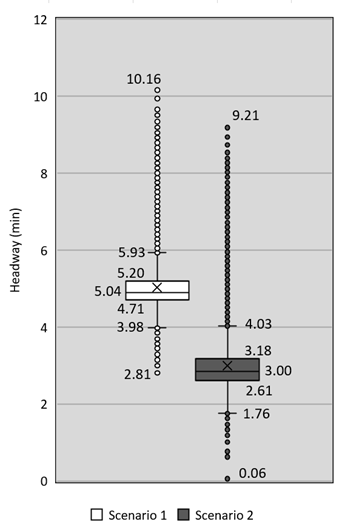
4. Headway Regularity: 10x More Reliable
- The current system had a headway Coefficient of Variation of 0.83, meaning buses arrived at highly irregular intervals.
- In Scenario 1, this dropped to 0.1, meaning headways were much more consistent.
For passengers, this translates to shorter and more predictable wait times at bus stops.
5. Fleet Optimization: Fewer Buses, Same Capacity
By reducing travel times, fewer buses were needed to maintain the same frequency:
- Current system: 27 buses required for peak service.
- BRT Scenario 1: Only 13 buses needed for a 5-minute headway.
- BRT Scenario 2: 21 buses for a 3-minute headway.
This means that operating costs could be reduced while maintaining or even improving capacity.
Conclusion: Why PTV simulation matters for future BRT planning
The study showed that a complete BRT corridor could dramatically improve bus operations in Stockholm, making transit faster, more reliable and more attractive to passengers. Using PTV Vissim and Viswalk, it was possible to quantify these benefits in a detailed and data-driven manner, providing insights that can support future planning efforts.
For cities considering BRT investments, microscopic simulation is a powerful tool for evaluating different strategies prior to implementation. In the case of Line 4, the results suggest that prioritizing high-capacity bus service through dedicated infrastructure could be an important step toward a more efficient and sustainable public transportation network.

Step up your
public transport planning game
Discover our guide to the best public transport service
Get clarity for your public transport planning
PTV offers a range of software tools to test and optimize your PT services


