
Table of contents
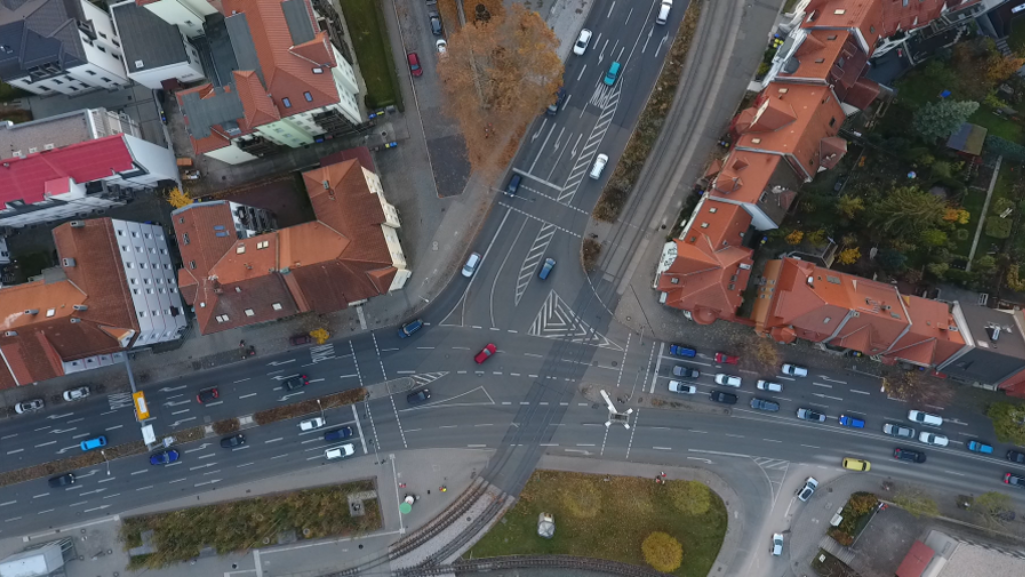
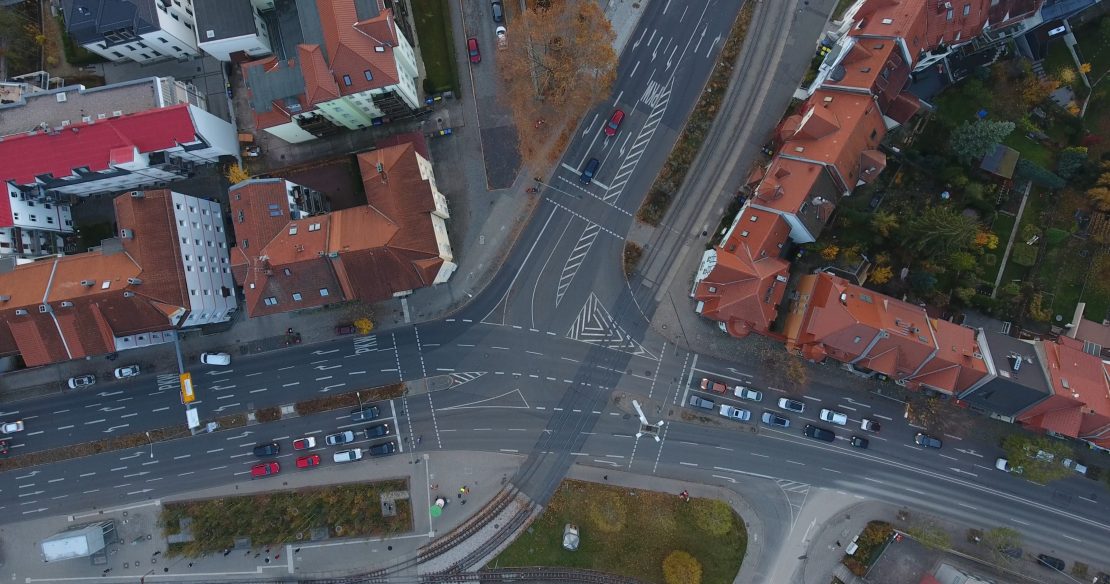
When I started working at the research node at Gothaer Platz in Erfurt – one of the city’s busiest intersections – my goal was clear: to determine if multi-source traffic data could inspire confidence in trajectory-based calibration in PTV Vissim.
Gothaer Platz is a challenging location. Two federal roads converge there, and the tram hub links lines 2 and 4. This made it an ideal place to study real traffic behavior in all its complexity.
[Note: This article is based on the webinar PTV Vissim | Research Node – Data Feed Microsimulation.]
Why Gothaer Platz?
Erfurt, an old trading city in eastern Germany, must balance its historic streets with modern mobility needs. This is evident at Gothaer Platz, where heavy traffic, multimodal flows, and a sensitive urban setting converge.
As part of the Bauhaus.MobilityLab living lab, we established Gothaer Platz as a research node. It now serves multiple purposes:
- It validates traffic sensors for planning and modeling.
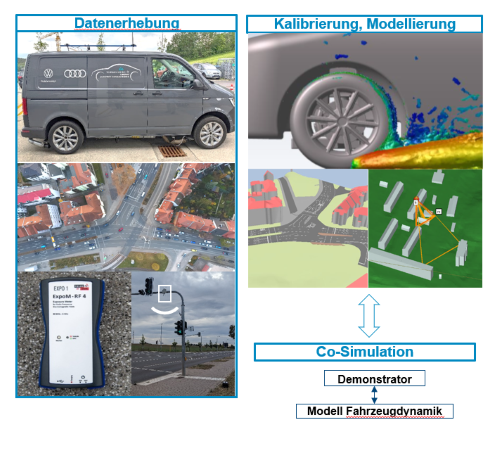
- Running tests in the project EMI-V on reducing non-exhaust emissions with a rolling emissions lab (a vehicle equipped with particle and brake wear sensors, as well as V2X-related electromagnetic measurements), and using PTV Vissim to test traffic control and link simulation to field data.
- Through the EDIH initiative, Gothaer Platz acts as a hands-on testbed where planners can learn about modern traffic sensor performance, typical failure models, and required quality checks.
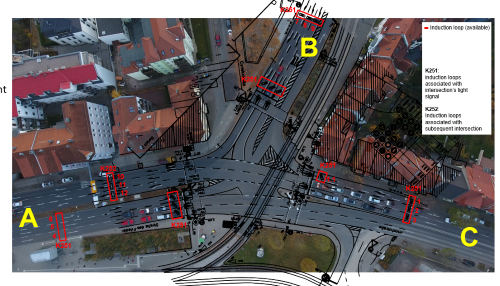
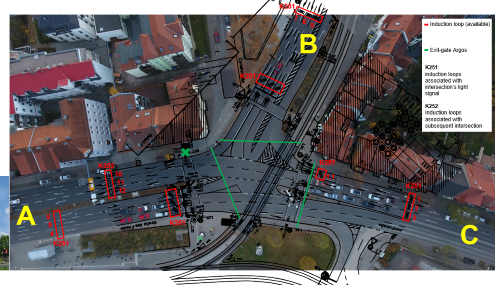
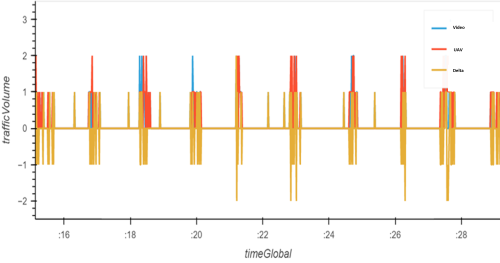
That’s why we brought multiple data sources together here. Detectors show volumes, but not behavior. Video systems show flows but not continuity. Floating car data samples trajectories but never the full picture.
Therefore, Gothaer Platz offered a rare opportunity to compare and combine these data sources to create a more credible foundation for trajectory-based calibration in PTV Vissim.
A 360° View of Reality
Gothaer Platz isn’t just another intersection. It’s a real-world laboratory where:
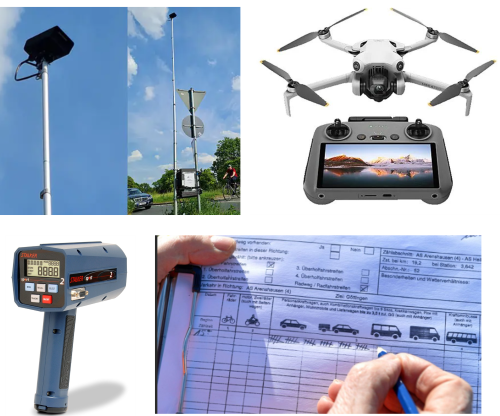
- Municipal detectors deliver continuous volume data,
- Mobile video systems capture complete turning movements for all modes,
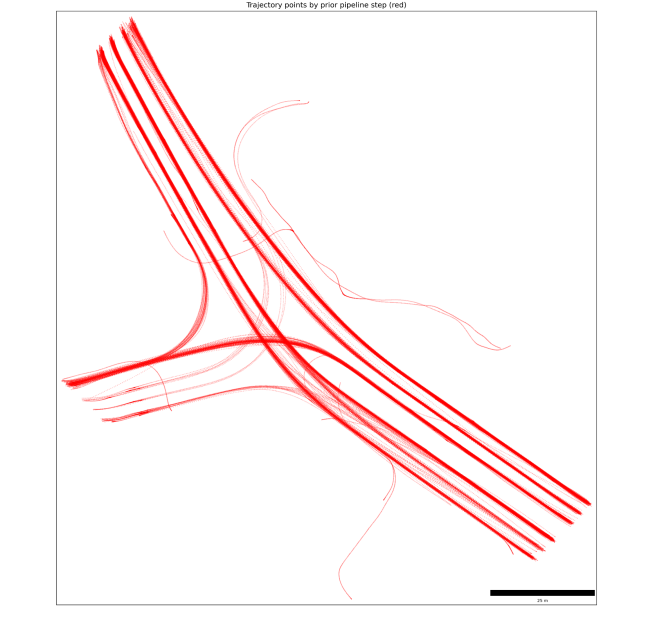
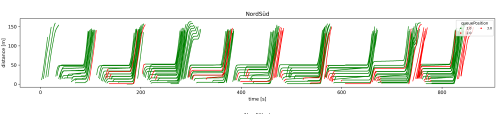
- Drone flights record high-resolution trajectories and driver behavior.
None of these alone represents the full truth. But together, they allow us to evaluate data quality, detect inconsistencies, and understand where each sensor performs reliably or falls short.
This multi‑perspective approach is essential for trustworthy modeling, especially when the ultimate goal is trajectory‑based calibration in PTV Vissim.
Why Multi‑Source Data Matters
Once we compared drone data with detector counts, even small deviations (one or two vehicles per minute) became meaningful over longer periods. These differences influence demand profiles, signal performance assessments, and queue formation.
Multi-source data answered questions that usually remain unanswered:
- Are detectors drifting?
- Are certain turning flows systematically undercounted?
- Are some trajectories physically implausible due to occlusions?
- Which sensor should be trusted for which calibration parameter?
This ability to validate the data before calibrating the model is the foundation of meaningful microsimulation, particularly when applying trajectory‑based calibration in PTV Vissim.
Trajectory‑Based Calibration in PTV Vissim
After cleaning the trajectories (removing unrealistic edges, fixing occlusions, assigning movements), they became inputs for trajectory‑based calibration in PTV Vissim.
This allowed me to calibrate:
- Acceleration and deceleration distributions
- Standstill distances and following gaps
- Driver reactions to signal changes
Instead of assuming realistic behavior, we observe and quantify it. This is the true strength of trajectory‑based calibration in PTV Vissim: it transforms behavioral realism from a guess into a measurement.
From Data to Operations
Data trust wouldn’t matter if it didn’t lead to better decisions. But it does.
With reliable behavioral inputs:
- Queue dynamics match real-world formation and dissipation.
- Signal timing changes can be tested with confidence.
- Spillback risks become predictable instead of speculative.
- Stop‑and‑go patterns can be evaluated for mitigation.
Operational optimization depends on behavior that actually occurs in reality, not the behavior we assume. This is precisely what trajectory‑based calibration in PTV Vissim delivers.
Limits to Note
I want to acknowledge limitations without overstating them:
- Drones offer unmatched behavioral insight, but only for short periods.
- Detectors provide continuous counts but lack trajectory detail.
- Video systems cover full flows but can suffer from occlusion.
The point isn’t that one method is superior. The point is that combining them builds trust – and trust enables better calibration.
Takeaways for Planners
1. Multi-source data provides multiple perspectives, not contradictions. Use them to evaluate quality before relying on any single stream.
2. Data trust must come before calibration. Correct offsets and inconsistencies before setting parameters.
3. Drone data is invaluable for behavior, but it’s not a replacement for continuous sensors. Use each method for what it does best.
4. Behavioral realism enables operational realism. Queues, spillback, and green-time efficiency depend on behavior, not counts.
5. The goal is defensible decisions, not perfect data. Trajectory‑based calibration in PTV Vissim helps you get there.
6. As part of the EDIH network, we support planners in adopting video- and ai-based traffic counting by clarifying capabilities and limits and demonstrating validation with reference data and multi-source cross-checks.
Conclusion
At Gothaer Platz, our goal wasn’t just to collect data; we wanted to understand reality well enough to confidently model it. Multi-source measurement, sensor validation, and trajectory-based calibration in PTV Vissim provided us with that confidence.
This setup also supported the EMI-V project, linking traffic control, driving behavior, and emission-related signals from the rolling emissions lab.
If you’re exploring similar approaches or want to learn how multi-source data can support your microsimulation work, please reach out to us. The research node and the dialogue are both open.

Calibrate for real‑world behavior
Learn how PTV Vissim supports robust operational tests – from green times
to emissions
Calibrate for real‑world behavior
Learn how PTV Vissim supports robust operational tests – from green times to emissions


