
Table of contents
What happens when 45,000 people leave a concert at the same time? As a traffic analyst at WSP, I used PTV Viswalk crowd simulation to test that scenario in Stockholm’s stadium district, where frequent events meet a changing urban plan and a new metro station.
Our model focused on three essentials: keeping inspection zones flowing, regulating inflow to platforms nearing capacity, and capturing how visitors reroute when queues build – evidence the design team needed to keep people moving safely and efficiently.
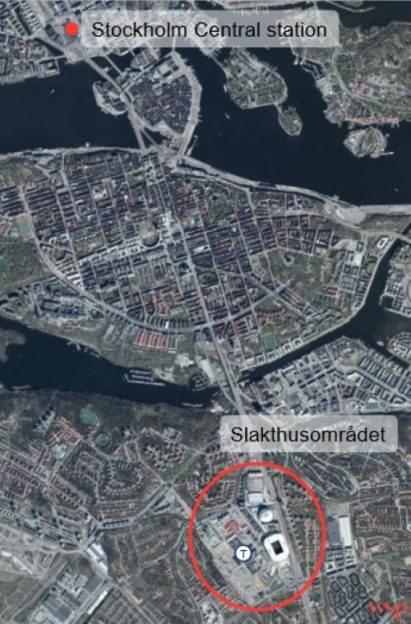
This work took place in Slakthusområdet, a former industrial area in Stockholm with major venues such as Avicii Arena and 3Arena. As the district transforms into a mixed‑use neighborhood – and the metro network evolves – daily travel patterns will shift.
Because large events are routine here, the public realm must work for both everyday operations and peak egress. Our simulations helped test those futures, showing how design choices and operating rules interact when crowds and vehicles share limited space.
Questions we set out to answer
In this PTV Viswalk crowd simulation, we set out to answer:
Event scenarios:
- What happens when 45,000 visitors exit the arenas within a 15-30‑minute period?
- What does arrival look like when 45,000 visitors come for an event at Tele2 Arena?
Model‑based questions covered in this article:
- How were gridlocks at the inspection zones resolved?
- How were metro entrance doors controlled to close when platform capacity was exceeded?
- How was dynamic route choice from Evenemangstorget to the metro modelled based on real‑time congestion?
- How was the overall situation evaluated?
Why PTV Viswalk crowd simulation
To support the architects in assessing design alternatives, we used PTV Viswalk. Viswalk is a microsimulation tool that captures detailed interactions between pedestrians and vehicles and can be paired with signal logic and capacity controls.
This allowed us to examine pedestrian-vehicle interactions at crossings and to test crowding on platforms and at bus stops within a single, coherent workflow.
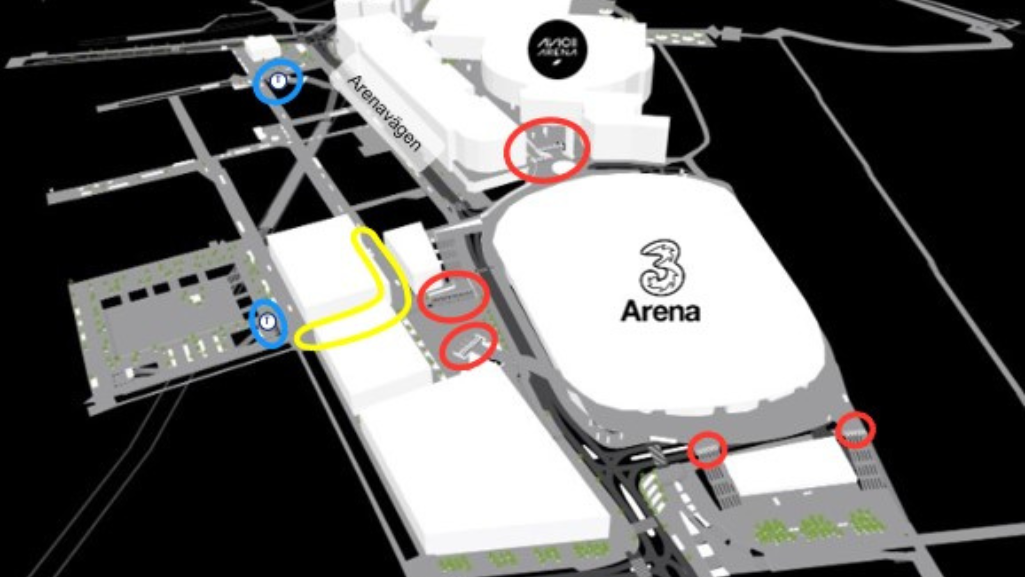
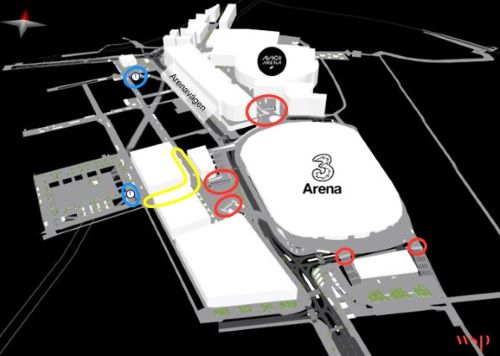
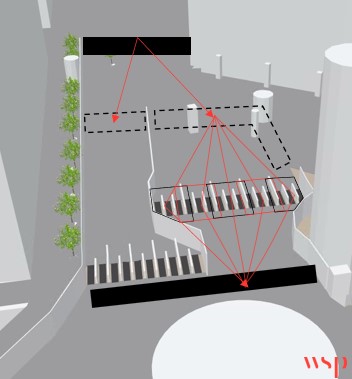
Our model covered Avicii Arena and 3Arena on the eastern side of Arenavägen. Because the metro entrances are on the western side, visitors must cross Arenavägen to reach the station – either at designated crossings or via the bridges connecting Evenemangstorget to the arena district.
This geometry defines the key conflicts we needed to test: where and when pedestrians should be prioritized, how inflow to platforms is regulated, and when alternative paths reduce pressure on the nearest entrance.
Challenges and Solutions
During the modelling process, several key challenges emerged:
Inspection Zones
The inspection zones function as security checkpoints where staff perform rapid checks to prevent prohibited items entering the venue. Under peak demand, pedestrians were sometimes pushed into incorrect queuing lanes, creating bottlenecks and occasional gridlock.
Demand profile. Visitors begin arriving roughly 90 minutes before the event, with the majority within 30-60 minutes. With a 7-9‑second service time per person, the theoretical capacity is 44,000-55,000 visitors over a 90‑minute period. In practice, uneven arrivals and an uneven split across inspection zones caused localized exceedances. When we modelled the process as standard queues, popular zones experienced spillback, and multiple pedestrians frequently entered the same inspection slot simultaneously.
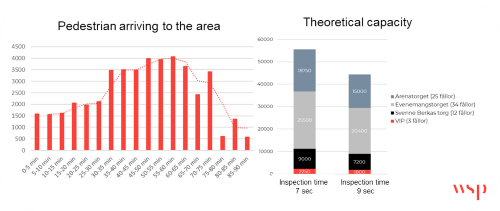
The arrival peak occurs shortly before start time, while the modeled 7-9 s service envelope shows that an uneven split across checkpoints can still overload popular lanes – even when aggregate capacity appears sufficient.
Intervention 1: Flow partition and guided corridors. In the PTV Viswalk crowd simulation, the inbound flow was first divided into two primary sections, then each section into five overlapping approach corridors. The overlap extended beyond the slots so that if a pedestrian drifted into the wrong lane, the path geometry still guided that pedestrian to the correct slot, reducing cross‑lane conflicts.
The overlapping geometry allows late corrections, so pedestrians drifting into the wrong lane are still guided to their intended slot, reducing cross‑lane conflicts.
Intervention 2: Slot control via VAP‑based signal logic. To eliminate simultaneous entries, each inspection slot was signal‑controlled with detectors and a timer:
- Two heads per slot: one at the entrance, one at the exit.
- Entrance detector: turns the entrance signal red once a pedestrian enters, starting the service timer.
- Service time: after ~7 seconds, the exit signal turns green for release.
- Exit detector: prevents the entrance signal from returning to green until the pedestrian has fully cleared the slot.
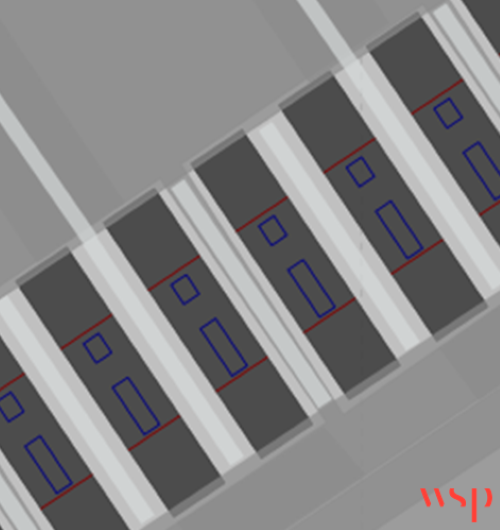
With the entrance held red until exit clearance, double entries were eliminated and throughput stabilized despite peak arrivals.
Outcome. The controlled, one‑by‑one processing markedly reduced double entries and stabilized throughput at the checkpoints.
Metro Entrances
Metro platforms have finite holding capacity, so inflow must be regulated to maintain safe densities and realistic operations. In the PTV Viswalk crowd simulation, we implemented platform protection by signal‑controlling the entrance doors and linking their states to the real‑time number of pedestrians on the platform. This mirrors common station practice for managing crowding and platform safety.
Control logic. Doors were modeled as signals driven by an attribute modification tied to live platform occupancy:
- Doors reopened only after occupancy fell below 600.
- When the platform count exceeded 600 persons, the signal switched to red (doors closed).
This configuration externalized queues to larger forecourt areas, where stewards can manage lines more safely without increasing platform risk.
Dynamic Route Choice
Visitors leaving via Evenemangstorget must choose between two metro entrances. In practice, route choice is adaptive: when the nearest entrance develops a long queue, many visitors walk to the alternative. In the PTV Viswalk crowd simulation, we reproduced this behavior with formula‑based routing tied to a monitoring area near Evenemangstorget.
Implementation:
- A monitoring area counted pedestrians in real time.
- If the count exceeded 100, 90% of arrivals were redirected to the northern entrance.
- Under normal conditions, a baseline share still chose the northern entrance to reflect familiarity and wayfinding variety.
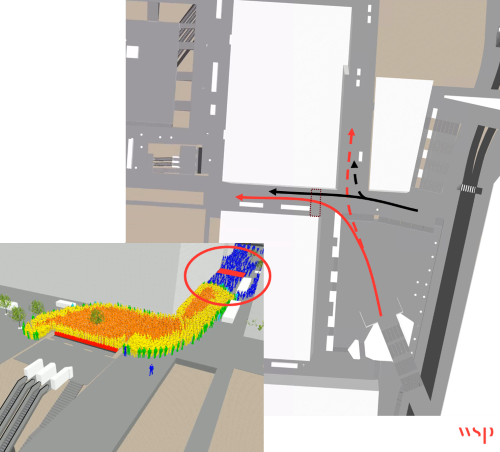
Effect: The logic captured how visible congestion shifts flows between the entrances, limiting back‑spill toward Evenemangstorget while preserving a realistic residual share to the northern route.
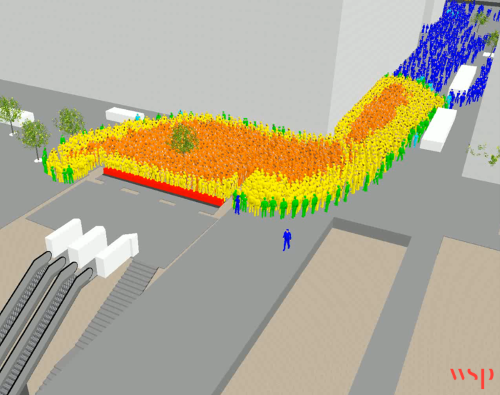
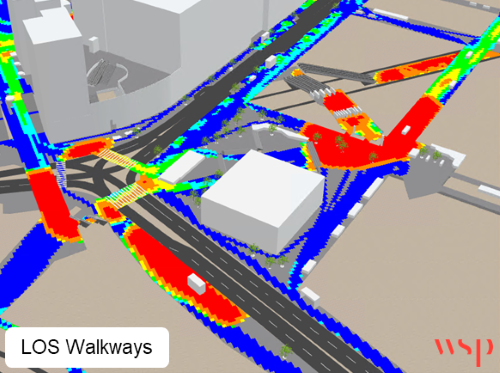
From Walkway LOS to Queuing LOS
Choosing the right evaluation metric was critical to compare design alternatives. In the PTV Viswalk crowd simulation, we initially used Walkway Level of Service (LOS) to visualize congestion. At very high volumes across large crowd fields, those heatmaps blurred priority hotspots.
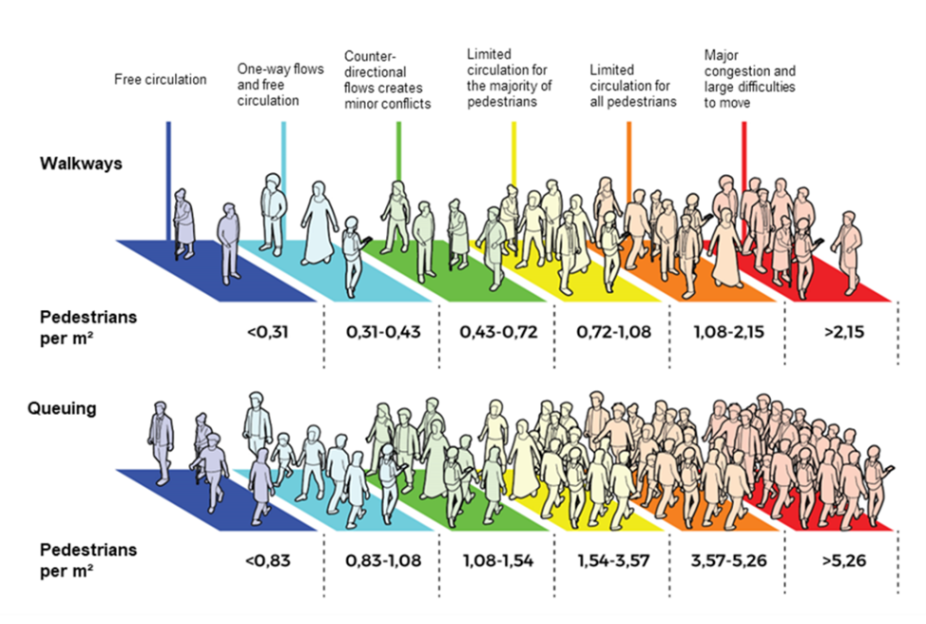
Because acceptable density is context‑dependent, we aligned the metric with conditions on the ground:
- One‑way flows / queuing can tolerate higher densities before comfort and safety degrade.
- Bidirectional flows need lower densities to remain stable.
- Daily routines have lower thresholds than special events, where higher crowding is expected.
Given the one‑way egress and event context, Queuing LOS proved more suitable. In this framework, sustained E–F areas signaled extreme congestion (≈ >5 persons/m²) that warranted operating controls or design changes (e.g., metering, queuing geometry, alternative routing).
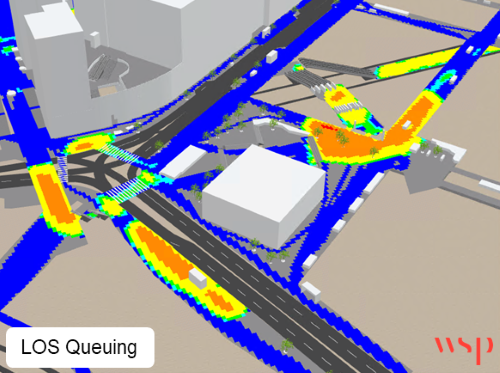
We assessed not only peak levels but also exposure – the area and duration of critical states – so alternatives could be ranked by density, footprint, and persistence of hotspots.
This change made true hotspots unambiguous and guided targeted design adjustments.
Conclusions and Lessons Learned
The PTV Viswalk crowd simulation confirmed where pressure concentrates and why: metro entrances/platforms and bus stops are the dominant bottlenecks. Heavy use of crossings along Arenavägen couples pedestrian surges with vehicle delay, so buses queue, miss stops, and lose outbound capacity. With simultaneous departures, metro capacity is insufficient, so excess demand must be metered upstream.
Lessons for practitioners
- Measure what matters. Walkway LOS blurred priorities at event scale; switching to queuing‑oriented LOS and occupancy‑linked door control made critical states unambiguous and actionable.
- Be ready to pivot. When standard approaches resisted calibration, we replaced them with targeted logic (e.g., door signals tied to live platform counts; formula‑based rerouting) to maintain momentum.
- Balance detail with runtime. Dynamic Potential was reserved for high‑impact zones; elsewhere, simplified geometry/behavior cut compute time without changing decisions.
- Reserve time for troubleshooting. Long runs, stochastic variation, and scenario iteration require explicit buffers for debugging and stability checks.
Operational implications
- Meter inflow at entrances and stage surplus queues in stewarded forecourts to protect platform conditions.
- If buses are part of the clearance plan, safeguard approach and dwell (queue protection or temporary controls), not only stop capacity.
- Compare alternatives on exposure – the size and duration of E–F states – rather than peak density alone.

Explore Traffic Simulation
See how traffic simulation supports event egress, pedestrian-vehicle interactions, and safer operations
Explore Traffic Simulation
How traffic simulation supports event egress, pedestrian-vehicle interactions, and safer operations
Related Posts


