

Table of contents
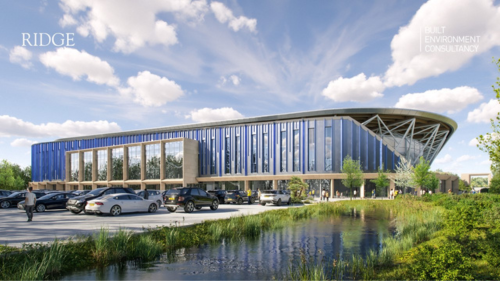
Oxford United Football Club (OUFC) received planning permission in August 2025 for a visionary, all-electric stadium, and construction will begin in 2026. The venue will host 16,000 fans and feature Oxfordshire’s largest conference facility, a 180-bed hotel, a restaurant, and a health and wellbeing centre. Here’s how our team of consultants used PTV tools for stadium traffic simulation to improve match-day mobility and safety.
The project’s goals
Ridge’s transport modelling team aimed to improve match-day traffic flow at the new venue. We worked with Oxfordshire County Council, National Highways, and public transport operators to develop the transport strategy, modelling, and design.
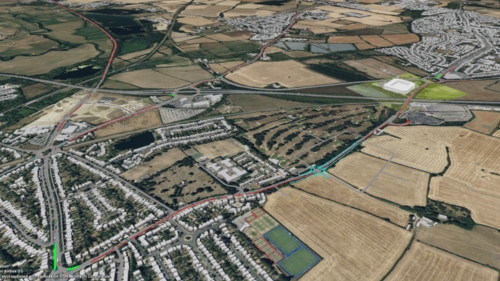
We used PTV Vissim to simulate the existing and proposed road network, and PTV Viswalk to model pedestrian flows. These simulations showed that crowds could move safely around the site, local neighbourhoods would remain protected, and the plan would perform well under pressure. The evidence-based approach helped gain stakeholder trust.
Stadium traffic simulation: Match-day challenges
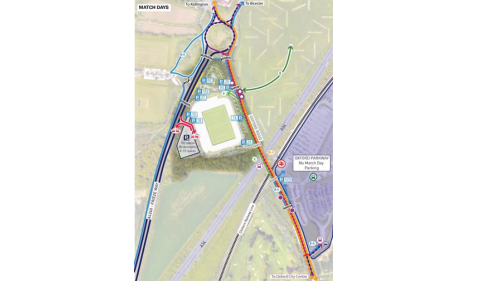
Football match days in the historic City of Oxford inevitably result in volatile and asymmetric traffic surges with arrivals and departures bunching into tight windows. Temporary closures and clear diversions are needed for safety, bus services must run reliably, and residents require local access.
The Transport Modelling team at Ridge was required to deliver facts, stats and images to the stakeholders, answering practical questions such as: How long should closures last? Where should diversions run? When should links reopen? And how quickly do queues clear after the whistle?
The modelling solutions
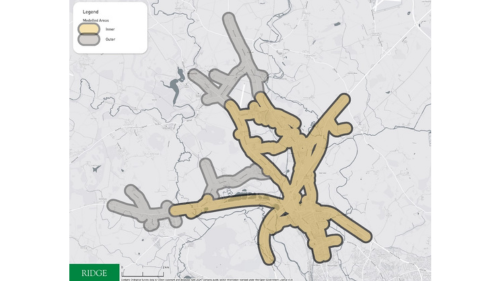
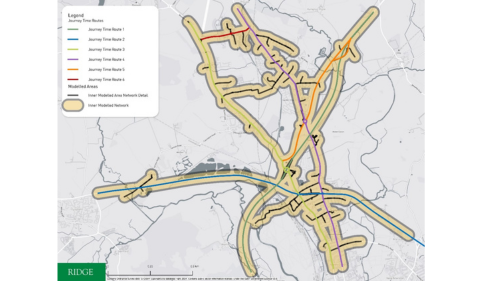
We created two five-hour PTV models covering North Oxford and Kidlington, capturing the different match rhythms: a weekday evening (18:00-23:00) and a weekend afternoon (14:00-19:00). We modelled cars, LGVs, HGVs and PSVs, as well as event shuttles and local buses. To clarify the time required for the diversion, we created a pre- and post-game Viswalk model for a full capacity match-day.
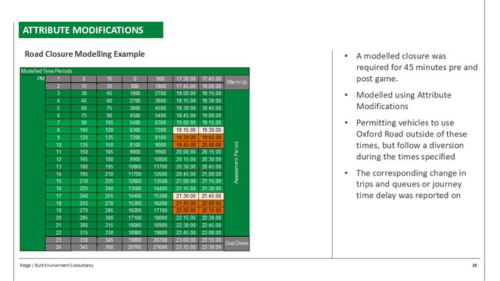
Timed diversions informed our route selection. We used fixed routing with attribute modifications and switched diversionary routes on and off at precise times. We also linked changes to planned TTRO windows and demonstrated precisely when the network state changed.
We used fixed routing rather than dynamic assignment due to the requirement to assess diversions twice within each modelled scenario.
Calibration covered link and turn counts, journey times and queue lengths. We validated bus journey times using operator data and verified the results using Vissim’s Link Visualisation tool. Finally, we produced a Local Model Validation Report.
Stadium traffic simulation: Turning points
During the process we evaluated multiple KPIs as one could be misleading, we reviewed the impact of the diversion through counts, travel time and queue impacts. We compared bus times with operator data, checking not just means but also percentiles, to deliver confidence to decision makers.
We also designed for operations, since capacity alone is insufficient. We evaluated bus priority during closures, reviewed shuttle headways and dwell points, and protected residential exits during peak egress.
Using animated clips, we demonstrated change, not just the current situation. We showed queues forming and dissipating and marked the exact minute a link reopened. We also highlighted when bus headways stabilised again. This sequence made sense to non-specialists.
Obstacles and solutions
As some of the data came from slightly different time windows, we normalised the inputs and logged the adjustments. We ran sensitivity tests to quantify the uncertainty and included these in the report to clarify our assumptions for the reviewers.
Bus journey data arrived in mixed formats, so we standardised the parsing process and performed cross-checks. We then compared this data with floating car runs and timetables, reporting both mean and percentile performance.
The diversion coding was complex because each fixed route required two states. Therefore, we duplicated the route IDs which intersected the route to be diverted and managed them using attribute modifications. This was time-consuming from an administrative perspective, but made auditing easy. Every change was given a timestamp.
Stakeholder priorities varied. Local authorities focused on neighbourhood impacts, while highway agencies focused on network resilience particularly on the SRN. We ran targeted scenarios to identify problem areas.
What the modelling showed
Temporary closures and diversions proved workable. Journey times were quantified for general traffic, buses, and event shuttles across weekday evenings and weekend afternoons.
Junction stability was confirmed. Blocking-back risks were identified and mitigated through adjusted signal settings and stewarding points. Reopening sequences were timed to clear queues quickly and restore flow.
Agility became a strength of the model. It tested longer or shorter closures, alternative diversion alignments, and different bus headways under varying demand levels. That flexibility supported constructive dialogue during consultation.
Most importantly, we built trust. Visual outputs aligned with tables and graphs, strengthening the evidence of what would happen and when. Meetings shifted from debate to decision because stakeholders could see the evidence in action.
Stadium traffic simulation: Lessons for planners of major venues
The next steps for OUFC focus on S106, legal agreements and delivery. Construction is expected to begin shortly, with the opening planned for later in the decade. However, as our work does not end with approval, we have now moved on to operations, planning and playbooks.
This stadium traffic simulation carries lessons that stretch beyond this project. Other stadium planners for football, rugby, motorsport or large concert venues may encounter similar issues. Therefore, our advice is to implement the following lessons we learned:
- Start modelling early to shape design and timings.
- Use fixed routing with timed attribute changes for closures.
- Validate with counts, times, queues and bus reliability.
- Design diversions for operations – not just capacity.
- Show change over time with short clips and clear captions.
- Keep a scenario library for governance and event plans.
- For more information about Transport Modelling, please contact Dave Cope at Ridge: davecope@ridge.co.uk
- Read more about securing approval for the OUFC planning application here.

Why use a traffic simulation?
Our free guide to effective transportation planning
Why use a traffic simulation?
Our free guide to effective transportation planning
Related Posts


