
Table of contents
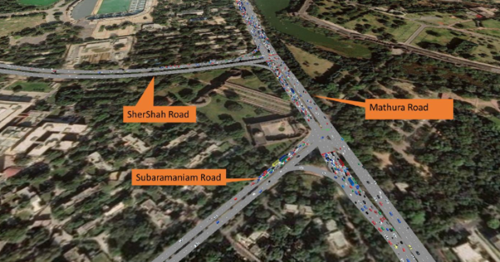
The Pragati Maidan-ITPO district in central Delhi is among the city’s most complex mobility environments. Surrounded by national event venues, intersecting arterial roads, and heavy pedestrian activity, the area faces recurring congestion during peak hours. Our objective was to build a robust simulation model of existing conditions, diagnose operational bottlenecks, and evaluate proposed geometric and traffic management improvements.
Microsimulation, powered by PTV Vissim, provided us the behavioral realism needed to make confident, evidence‑based decisions for this challenging urban context.
Here is how we did it – and the lessons that may apply to planners of similar projects worldwide.
Why Vissim microsimulation?
The corridor’s traffic is heterogeneous and non‑lane‑based, with frequent manual signal operation during peaks. We needed to capture mixed modes (cars, two‑wheelers, auto‑rickshaws, buses, heavy vehicles), pedestrian interactions, and irregular control strategies within a single framework.
Vissim’s conflict‑based priority rules, stochastic dynamics, and flexible signal logic allowed us to embed local behaviors and test design alternatives rigorously – tested virtually rather than on the street.
Building the base model: Delhi’s driving reality
We reconstructed network geometry precisely from base‑year CAD plans, on‑ground inventory, and satellite references to ensure spatial accuracy at the link‑and‑lane level. The crucial step was behavioral calibration. Using Wiedemann‑74 car‑following, we tuned parameters to reflect narrow lateral clearances, shorter reaction times, high lane‑change frequency, and complex overtaking patterns typical of urban Delhi.
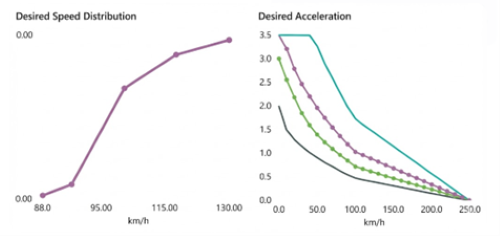
We assigned the desired speed and acceleration distributions, as well as vehicle dimensions, based on empirical Indian datasets, ensuring realism across the full fleet mix. Static routing replicated observed directional splits at entries, focusing on the critical evening peak 18:00-19:00.
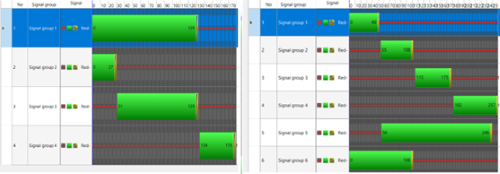
Field observations indicated T‑junction cycles around 170-180 seconds and the main four‑arm junction near 240 seconds, often with manual adjustments in peak periods. These were mirrored these conditions so that saturation, queue formation, spillback, and effective green loss, matched ground conditions.
Ensuring reliability
The simulation covered 4,500 seconds in total: 900 seconds warmup, plus a 3,600‑second operational peak. To manage stochasticity, we ran five random seeds and evaluated stability across key outputs. Calibration aligned queue lengths, average speeds, and throughputs at major junctions. For validation, we applied the widely used GEH statistic at turning‑movement level.
The model achieved an average GEH of 4.93, within the accepted threshold where ≥85% of movements are GEH < 5. On of the reasons for lower GEH is the homogeneity of the traffic composition in the study area. Minor deviations were attributed to inherent variation in manual counts. In short, the base model was reliable and closer to ground conditions.
What the base year revealed
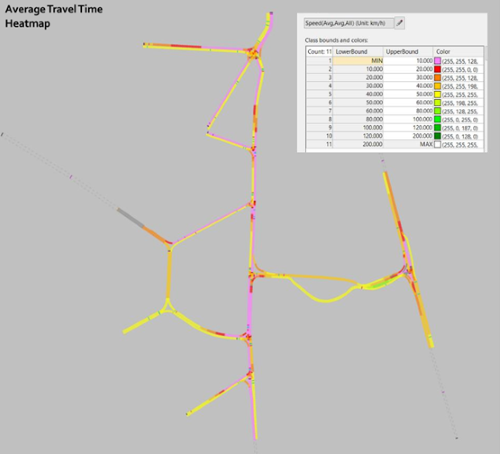
Peak‑hour saturation occurred at almost all major junctions. Long cycles and blocking effects reduced effective green, generating spillbacks that propagated upstream. Interactions between faster vehicles and slower modes near merges and turning pockets caused turbulence, accelerating queue build‑up. Heat maps highlighted low‑speed clusters near convergence points, and high‑friction zones where pedestrian and vehicular flows competed for limited space.
Virtually validating a design
The project architect’s proposal was tested in Vissim to validate feasibility within existing constraints and refine details where operational risks emerged.
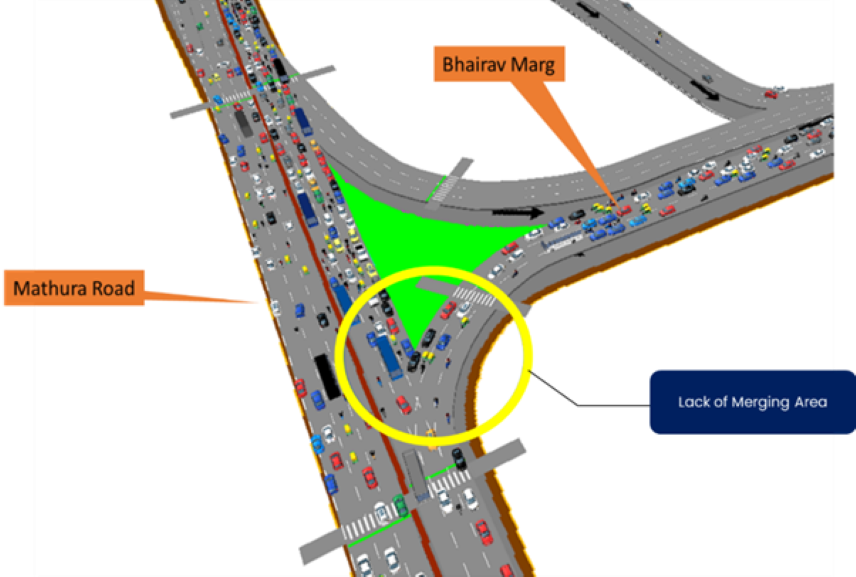
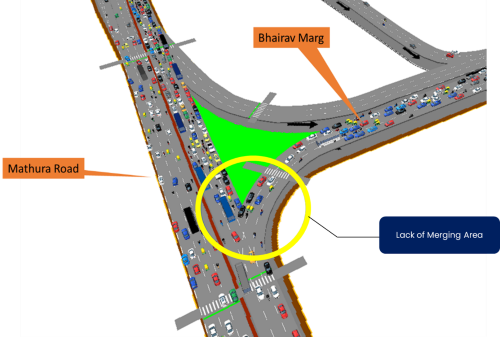
The most critical finding was at the Bhairav Marg – Mathura Road interface: inadequate merging length caused abrupt deceleration, intense gap competition, and spillovers that degraded the mainline. Limited taper and constrained geometry amplified lane‑changing conflicts, depressing speeds and throughput. In other words, the design carried implementation risk unless the merge geometry was optimized.
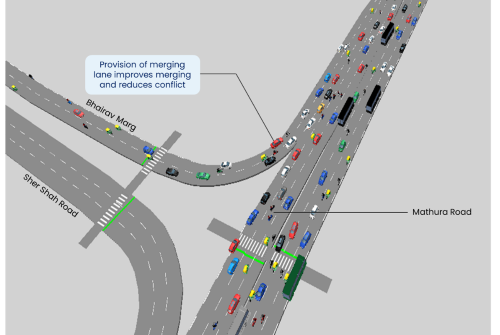
To address the merge, we introduced a dedicated merging lane to extend acceleration and gap‑seeking distance. This reduced conflict intensity, smoothed mainline flow, and shortened side‑road queues.
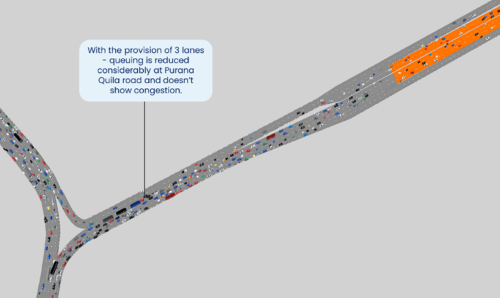
To plan channelized flow of vehicles, it was recommended three lanes on the approach to Purana Quila Road. By removing the downstream bottleneck, discharge improved, queues dissipated, lane‑changing pressure fell, and stop‑and‑go behavior subsided – raising travel‑time reliability across the link.
How microsimulation reduces risk
For stakeholders, the Vissim model served as a decision-support tool to compare “Do Nothing” and proposed scenarios transparently. It allowed evaluation of queue lengths, travel times, junction delays, and overall level of service under different conditions.
The model also revealed conflict points for design refinement and supported rationalization of signal timing strategies. It enabled safe testing of pedestrian infrastructure and traffic management measures that would be risky to trial on-site.
By quantifying impacts before execution, we reduced implementation risk, improved safety, and directed investment toward measurable network improvements.
Insights for planners using microsimulations
While our project took place in Delhi, it offers several insights for planners elsewhere:
- Model local behavior, not just geometry. Risk often hides in behavioral nuances – gap acceptance, lane‑change frequency, and pedestrian interactions. Calibrate to local norms so the model reflects operational reality, not idealized assumptions.
- Validate with defensible metrics. Use GEH, multi‑seed runs, and observed cycles to ensure statistical credibility. Decisionmakers will back designs that withstand quantitative scrutiny.
- Interrogate merges and tapers early. Short merge lengths and constrained channelization are risk multipliers. Widening is not the solution, as it invites merging issues. Microsimulation reveals where small geometric refinements avert large‑scale performance failures.
- Simulate control strategies under stress. Long cycles, manual overrides, and event surges can erode effective capacity. Test signal phasing and coordination under peak stress to preempt spillback and blocking.
- Use the model as a shared language. A calibrated digital twin aligns architects, engineers, and authorities around evidence, reducing stakeholder friction and accelerating implementation.
Conclusion: Safe from design to delivery
For the ITPO corridor, microsimulation with PTV Vissim helped us identify risks early and validate proposed designs effectively.
We suggested geometric fixes that stabilized traffic flow and improved reliability across the corridor during peak conditions.
More broadly, this illustrates that simulation allows us to test before implementation. The simulation tool gives confidence to take decisions on design improvement before on-ground implementation with better traffic management.
Behaviorally realistic microsimulation is not just an analytical tool – it is a risk‑management strategy that turns confident design into competent delivery.

Reduce risk in urban mobility projects
See how PTV Vissim microsimulation supports and validates your designs
Reduce risk in urban mobility projects
See how PTV Vissim microsimulation supports and validates your designs
Related Posts


