

Table of contents
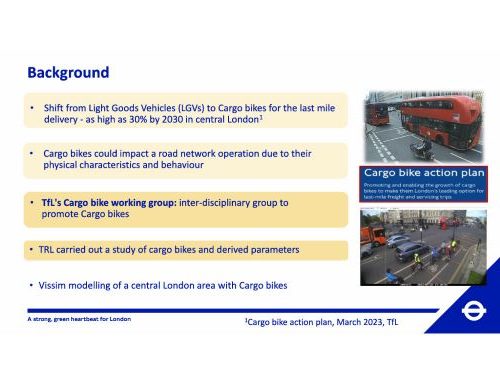
Cargo bike traffic simulation is now essential as cargo bikes are becoming increasingly popular in cities. Using PTV Vissim, Transport for London modelled the Parliament Square area to test network effects when a share of light‑goods vehicles shift to cargo bikes.
The Vissim model captured width, acceleration, lateral behavior and overtaking, and assessed interactions with lane geometry, segregation and junctions. Results show clear thresholds: narrow lanes restrict passing and amplify cyclist delay, while segregated facilities keep general traffic and buses stable; cars and taxis can benefit as vans decline.
Led by TfL’s Birendra Shrestha and Evangelos Kotsialos, this work offers practical guidance: design for overtaking with effective widths, prioritise segregation on busy corridors, and use scenario testing to de‑risk delivery.
[This article is based on the webinar PTV Vissim | Modelling Cargo Bikes in London’s Road Network, part of PTV’s Spotlight Talks series.]
Cargo bike traffic simulation: behavior & design
Cargo bikes vary significantly in design: front loaders, longtails, trikes and emerging four‑wheel cargo platforms. These designs differ not only in geometry but also in maneuverability, rider behavior and acceleration characteristics.
For planners, this creates real uncertainty. Standard cycling models are not sufficient, because:
- Additional width affects overtaking and lateral positioning
- Slower acceleration alters queue formation at junctions
- Larger turning radii affect behavior at narrow corners or shared paths
- New e‑assist models change speed stability under loads
- Emerging vehicle types lack robust field data
Without simulation, assumptions risk oversimplifying how cargo bikes behave – especially in dense, high‑demand corridors where every meter of lane width affects flow. This is where cargo bike traffic simulation with PTV Vissim provides the necessary behavioral realism to explore overtaking, lateral movements, and queue formation in congested conditions.
TfL’s cargo bike traffic simulation in PTV Vissim
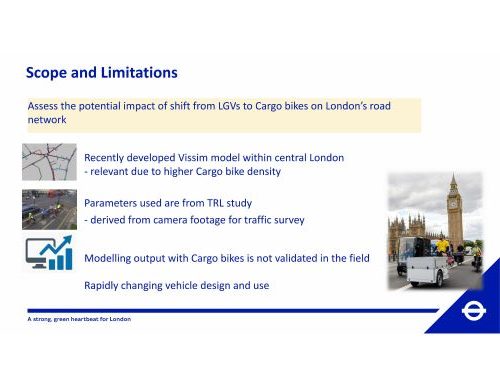
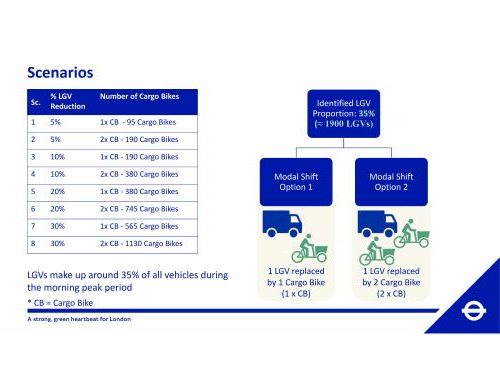
Transport for London undertook a detailed Vissim microsimulation study in the Parliament Square area – one of London’s busiest and most complex multimodal nodes. To evaluate cargo bike traffic simulation outcomes at this complex multimodal node, TfL modelled Parliament Square with mode‑shift scenarios replacing 5–30% of LGVs.
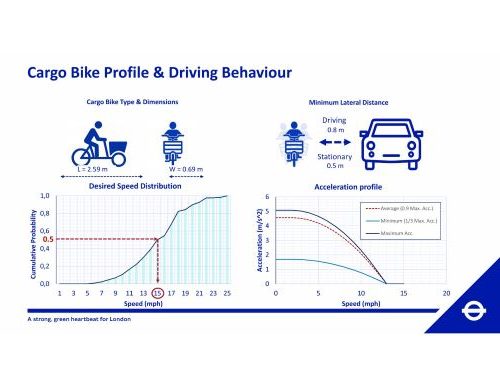
TfL’s team derived cargo‑bike parameters from roughly 200 on‑street observations, covering attributes such as: length and width, desired speed distribution, acceleration and braking behavior, lateral movement tendencies, and minimum overtaking distances.
To maintain reliability, TfL limited its scope to two‑wheel cargo bikes, since field data for four‑wheel cargo bikes was insufficient. They also adopted clear modelling assumptions:
- Cargo bikes use cycle infrastructure wherever available
- No overtaking into opposing‑direction lanes
- Van routing patterns were unchanged (micro‑hub effects not modelled)
- Cargo‑bike flow and travel‑time validation was not possible due to lacking field data
Scope note: results apply to two‑wheel cargo bikes; four‑wheel cargo platforms were out of scope due to limited field data.
These limitations demonstrate why simulation is required: the rapid pace of cargo‑bike innovation outstrips available real‑world evidence.
From vehicle traits to network effects
A central insight from the study is that the interaction between vehicle characteristics and infrastructure geometry creates network impacts that are larger than expected.
Micro level: Width & acceleration
Two characteristics stood out:
- Cargo bikes accelerate more slowly than standard bicycles
- Their greater width reduces maneuvering space for overtaking
In combination, these traits create queuing effects in narrow cycling lanes because faster cyclists cannot pass as freely. The slower take‑off increases delays at junctions, while the width restricts lateral movement.
Meso level: Infrastructure limits
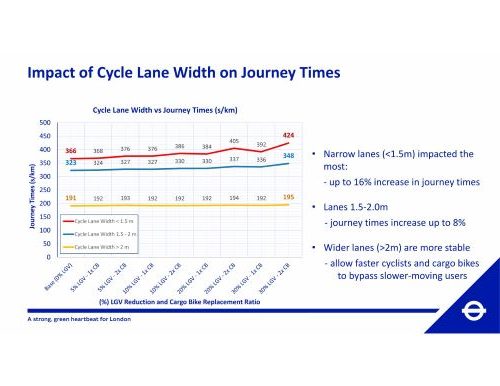
Vissim simulations revealed clear infrastructure thresholds:
- Cycle lanes under 1.5 m experienced the highest increases in delay – up to ~60% in some scenarios.
- Lanes wider than 2 m showed significantly more stable performance due to overtaking opportunities.
- Segregated facilities reduced conflicts between cargo bikes and general traffic.
- High‑demand corridors amplified delays where lane width was limited.
This reinforces a key cycling‑infrastructure insight: small variations in effective width can dramatically change performance under rising demand.
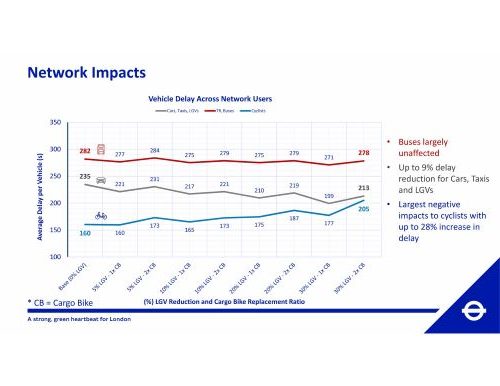
Macro level: Network outcomes
The most notable outcome was that cargo‑bike adoption produced mildly surprising effects:
- General traffic and buses remained stable.
- Cars and taxis experienced slight improvements thanks to fewer vans.
- Cyclists experienced increased delays, especially on narrow or high‑demand links.
- Segregated infrastructure enabled positive system‑level results by keeping cargo bikes out of motor‑traffic lanes.
This demonstrates the value of multimodal traffic simulation: results are not always intuitive, and infrastructure design plays a decisive role.
Why PTV Vissim for cycling‑network planning
PTV Vissim supports rigorous cargo bike modelling by enabling planners to:
- Build custom cargo‑bike vehicle classes with realistic widths, acceleration curves and behavioral parameters.
- Capture lateral behavior and overtaking constraints in narrow cycle lanes.
- Simulate segregated cycling infrastructure and detailed junction layouts.
- Conduct scenario‑based experiments for mode shifts, replacement ratios and routing strategies.
- Analyze both local bottlenecks and networkwide multimodal impacts.
How to replicate: Start with custom vehicle classes and lateral behavior; then scenario‑test lane width and segregation alternatives in PTV Vissim.
For cities anticipating large‑scale cargo‑bike adoption, these capabilities allow engineers to make evidence‑based decisions about lane widths, segregation strategies, junction design and cycling‑network capacity.
Key lessons for mobility planners
- Cargo bikes can be simulated explicitly in traffic studies.
- Width and slower acceleration can affect cycling‑network performance.
- Narrow cycle lane widths could increase congestion under higher cargo‑bike volumes.
- Segregated cycle lanes improve outcomes across multiple modes.
- Scenario testing is essential because effects are not intuitive.
- Emerging vehicle types require adaptable, behaviorally rich simulation tools.
For cities planning capacity upgrades and segregation strategies, cargo bike traffic simulation is the fastest way to de‑risk design choices before they reach the street.

Urban mobility planning: simulation‑first strategies
Our experts’ free guide
for mobility and transportation planners
Urban mobility planning: simulation‑first strategies
Our experts’ free guide for mobility and transportation planners


