
Table of contents
Urban intersections are often the pressure points of a city’s transport network. In a city like Hyderabad, India, where traffic is dense, diverse, and often unpredictable, these intersection delays can become serious bottlenecks. As a civil engineer working on urban mobility challenges, I set out to answer a deceptively simple question:
What’s the most accurate and practical way to estimate delays at intersections?
While this research was carried out in Hyderabad, it carries lessons to traffic engineers all around the world.
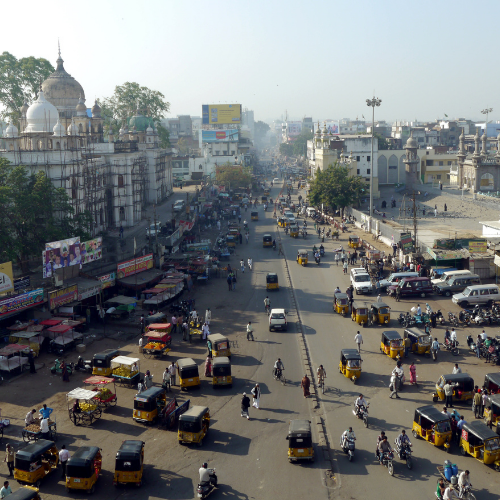
Why Indian Intersections Are a Unique Challenge
For international readers, it’s important to understand that Indian traffic conditions are fundamentally different from those in many Western cities. We deal with:
Adaptive signal behavior: signal timings can vary in real time, complicating any static analysis.
Heterogeneous traffic: two-wheelers, three-wheelers, buses, cars, and even animal-drawn carts share the same space.
Weak lane discipline: vehicles often don’t follow marked lanes, making flow patterns highly irregular.
A Triangulated Approach: Simulation, Analytics, and Field Data
To tackle this, we studied 10 major intersections in Hyderabad, including Bowenpally, CTO, and Hitech City. We used a triangulated approach:
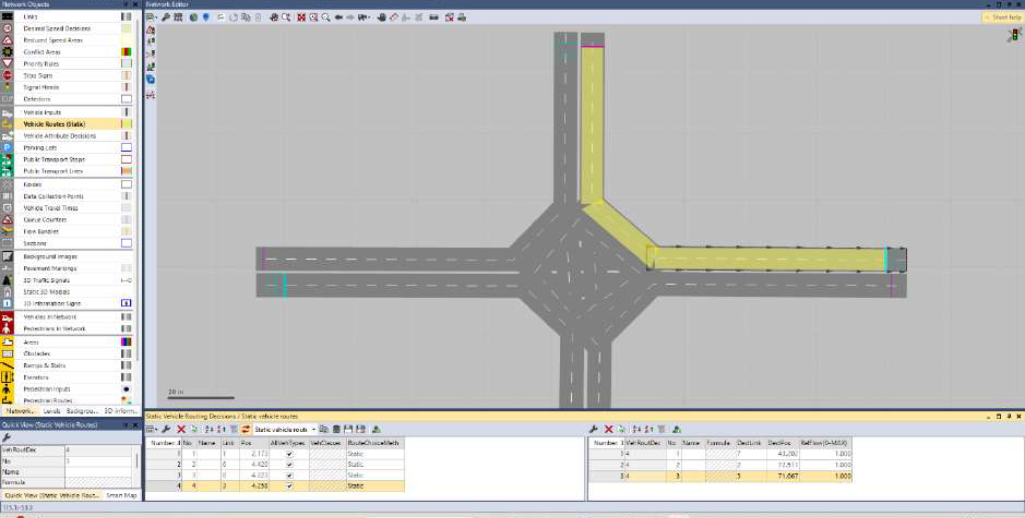
1. PTV Vissim Simulation
We recreated each intersection in PTV Vissim using actual road geometry, signal timings, and vehicle compositions. The modeling process included:
- Assigning vehicle types (2W, 3W, cars, buses, etc.) with real-world ratios.
- Configuring signal controllers with actual cycle and green times.
- Calibrating driver behavior to reflect Indian driving patterns – a process that required iterative testing and adjustment of parameters like lane-changing aggressiveness and gap acceptance.
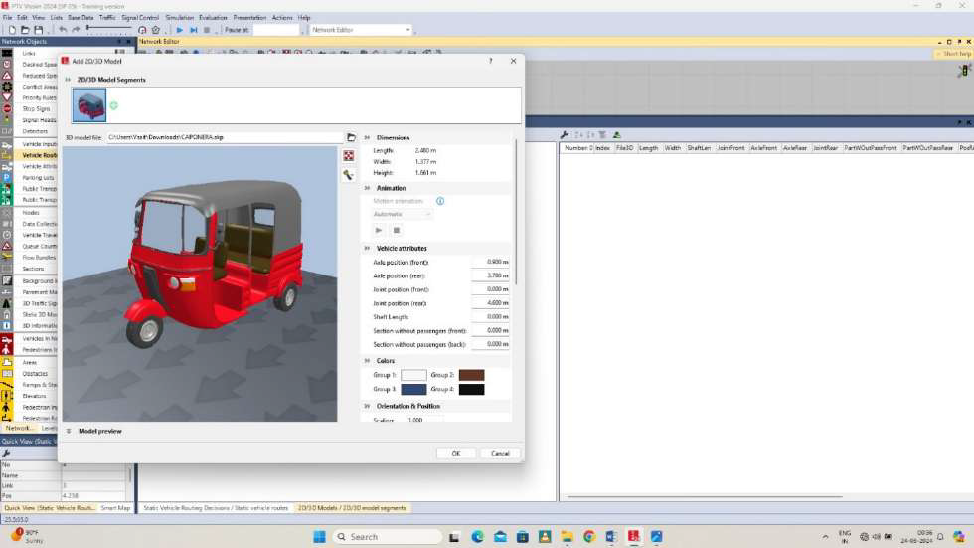
Assigning vehicle type in PTV Vissim, in this case 3W
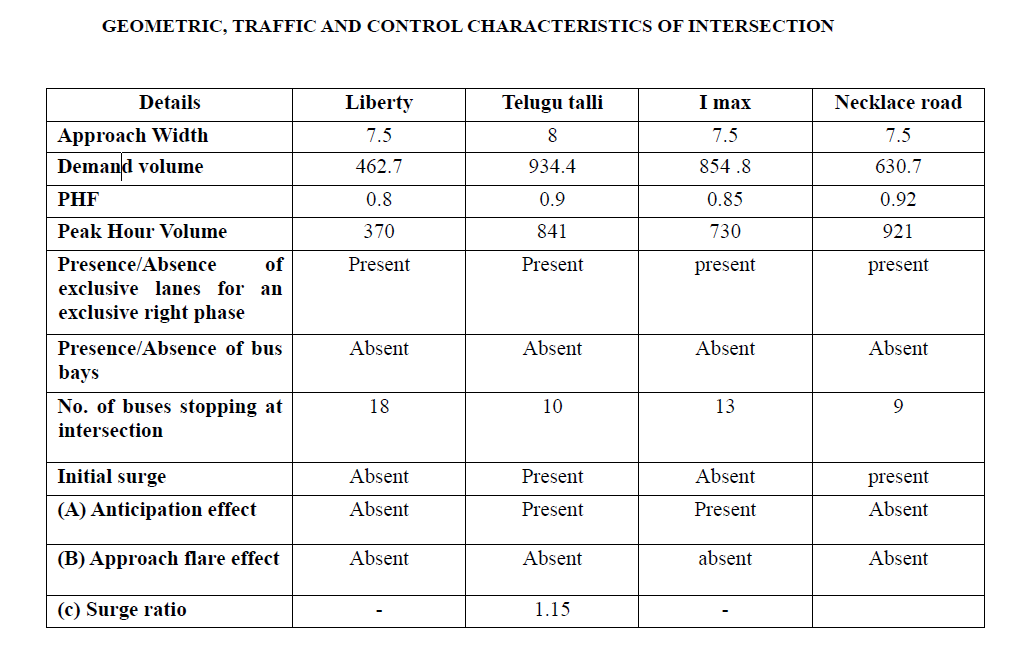
2. Indo HCM Analytical Method
We applied the Indo HCM formulas to compute delays based on:
- Approach width
- Saturation flow
- Signal timing
- Adjustment factors for bus blockage, right-turning vehicles, and initial surge effects
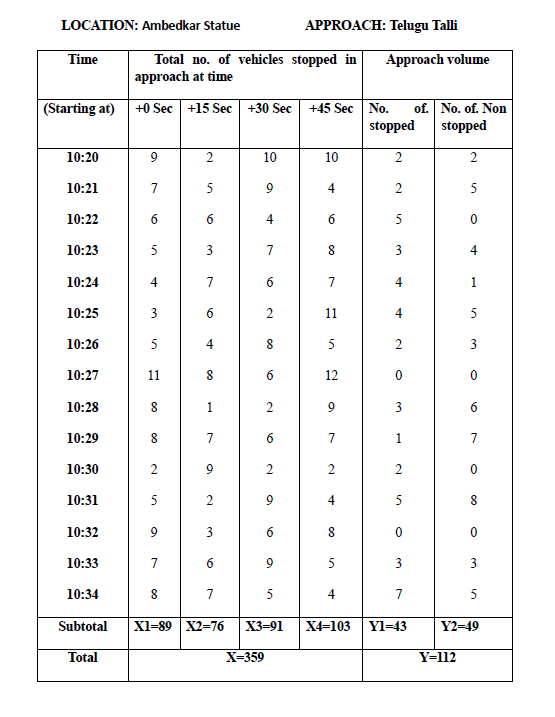
3. Field Delay Studies
We conducted video-based observations at each intersection, calculating:
- Percentage of vehicles stopped
- Total delay
- Average delay per stopped vehicle
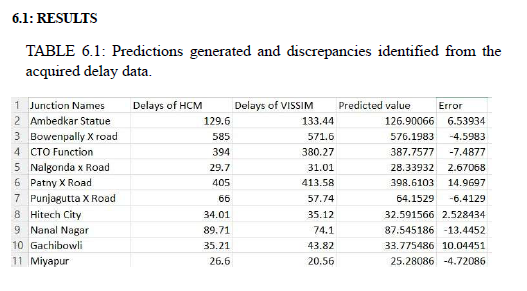
Intersction delay analysis: Key Results
Our triangulated approach yielded several measurable outcomes that validate the effectiveness of using PTV Vissim in complex urban environments:
- 20% reduction in simulated congestion delay was achieved through optimized signal timing strategies identified via Vissim.
- High correlation with real-world data: Vissim’s delay estimates showed a strong correlation with field observations, with an R² value of 0.92, outperforming the Indo HCM method.
- Estimated 15–25% time savings were projected when applying improved signal coordination strategies derived from simulation insights.
- Critical intersections identified: Locations like Bowenpally and CTO Junction were flagged as high-impact areas where minor signal timing adjustments could significantly improve throughput.
- Regression modeling confirmed the reliability of Vissim’s predictions, with a multiple linear regression model incorporating PCU volume, road width, cycle time, and green time to estimate delays with high accuracy.
What We Learned
This study reinforced the value of combining simulation, analytical models, and field data to understand and manage intersection delays. PTV Vissim stood out not just for its accuracy, but for its adaptability to local traffic conditions – especially in environments with high vehicle diversity and limited lane discipline.
By simulating real-world scenarios, we were able to identify subtle inefficiencies, like suboptimal signal timings, that traditional methods often overlook. The ability to visualize traffic flow and test interventions virtually gave us a deeper understanding of how small changes can lead to significant improvements.
Lessons for International Planners
While our study focused on Hyderabad, the methodology is transferable. Cities with:
- Mixed traffic conditions
- Limited lane discipline
- Inconsistent signal coordination
…can benefit from a triangulated approach that combines simulation, analytics, and field validation.
PTV Vissim proved especially valuable because it allowed us to test interventions virtually before recommending them in the real world. It also helped us bridge the gap between theoretical models and on-the-ground realities.
Looking Ahead, we see strong potential in integrating real-time traffic data and AI-based signal optimization into Vissim models. This would enable cities to move from reactive to proactive traffic management – especially in rapidly growing urban areas.

Rethink Urban Traffic with Simulation
Discover how simulation tools like PTV Vissim transform urban mobility planning
Rethink Urban Traffic with Simulation
Discover how simulation tools like PTV Vissim transform urban mobility planning


