

Table of contents
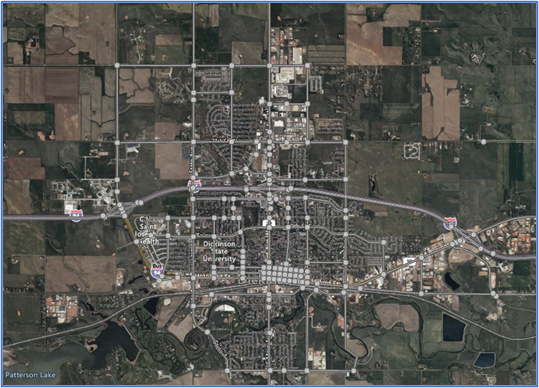
Dickinson, North Dakota, with a population of 25,000 and a metro area projected to reach 50,000 in 25 years, needed a travel demand model that balanced detail with feasibility. To guide growth, a transit master plan and a comprehensive plan were developed.
While Dickinson’s size required a robust model, a full four-step or activity-based approach was impractical. Our engineering firm, KLJ Engineering LLC, addressed this issue by integrating PTV Vistro and StreetLight Data, combining trip generation, origin-destination (O-D) data, and trip assignment. This flexible model allows the city to update forecasts as growth evolves.
We’ve also talked about this project in an episode of the webinar series PTV Talks – Spotlight.

The project began with the collection of StreetLight Data at intersections, calibrated to North Dakota Department of Transportation (NDDOT) Average Daily Traffic (ADT) counts and adjusted for seasonal variations. The ADT data helped create a Traffic Analysis Zone (TAZ) matrix that mapped current and future trip distributions.
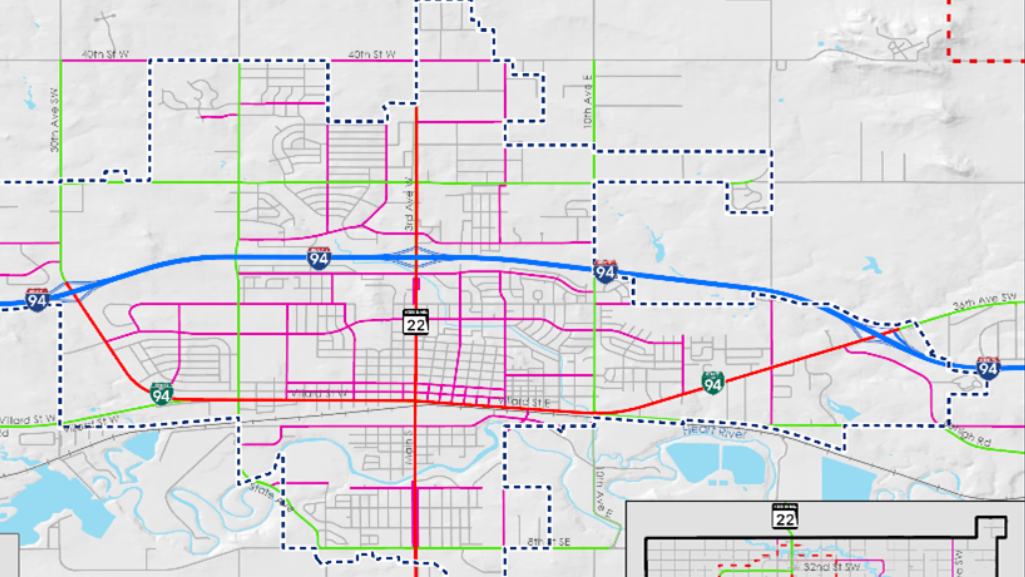
PTV Vistro enabled a macroscopic model to analyze arterial and collector intersections. By incorporating turning movements and TAZ trip generation, it identified the impact of future development on the regional roadway network. The travel demand model shows where Dickinson needs to proactively plan intersection and corridor improvements to prevent capacity strain as development accelerates.
Methodology
Selecting the right software
The project began with an evaluation of PTV software options, considering Vistro and Visum. Vistro was selected for its ability to assess intersection-level service across the metropolitan area, its macroscopic modeling approach, and its ease of updating ITE trip generation.
Building the Travel Demand Model
OpenStreetMaps was used to export the city’s streets into Vistro, where intersection configurations, speed limits, controls, and signal timing were refined. To optimize model size, only streets with more than 1,000 daily vehicles were included.
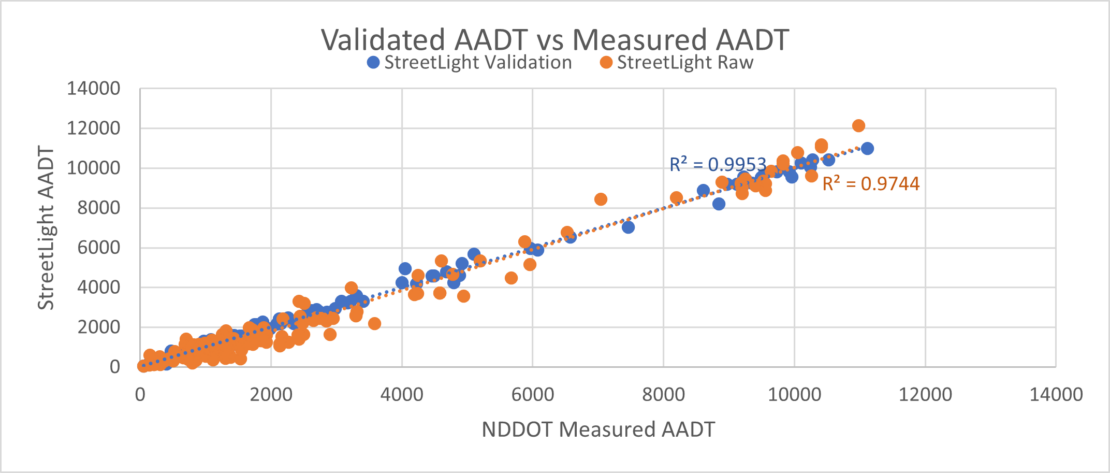
StreetLight Data provided daily, AM peak, and PM peak volumes that were calibrated to NDDOT ADT counts. Peak hour counts were also compared to maintain peak percentages. We tested both location-based service data from 2021 and connected vehicle data from 2022. The latter showed significantly less variance against Annual Average Daily Traffic (AADT) data and was ultimately selected for the project.
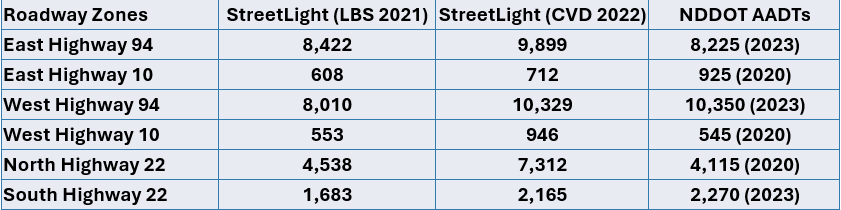
Raw StreetLight Data compared to NDDOT AADTs had an R-squared value of .9744, with an after-calibration R-squared value of .9953, as shown in the graph below. Using exported volume sheets from Vistro, each intersection was filled in using VLOOKUP and index functions in Excel, scaling the peak hour volumes while maintaining the percent of daily volume validation.
Mode Numbering System
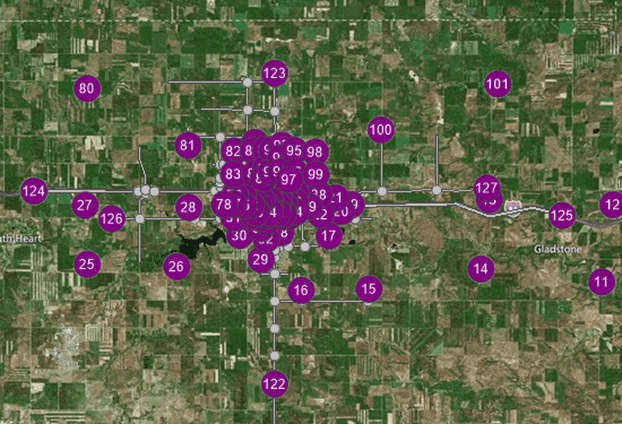
After exporting peak hour volumes to a CSV, we reimported them into Vistro. With many intersections modeled, we developed a node numbering system for easy identification. Each intersection received a four-digit code: the first two digits (10–90) represented north-south orientation, and the last two (10–90) indicated east-west positioning.
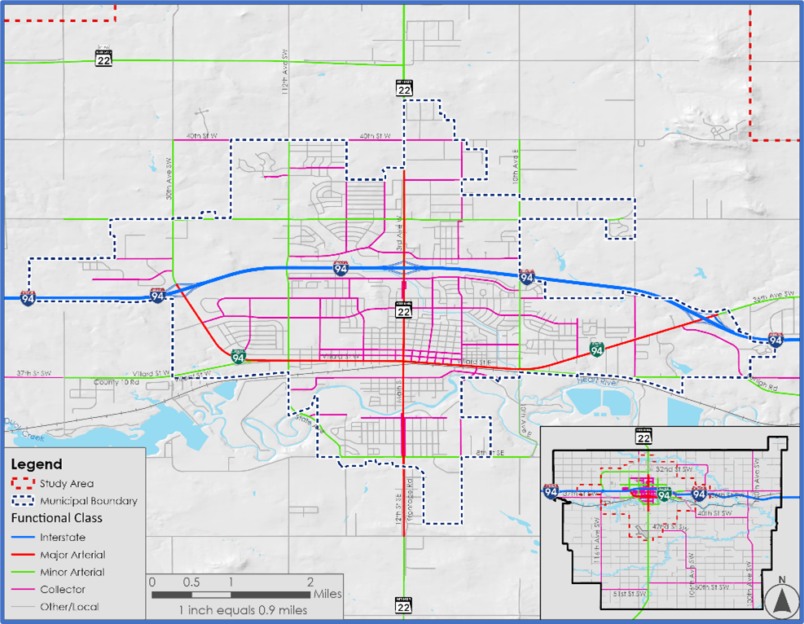
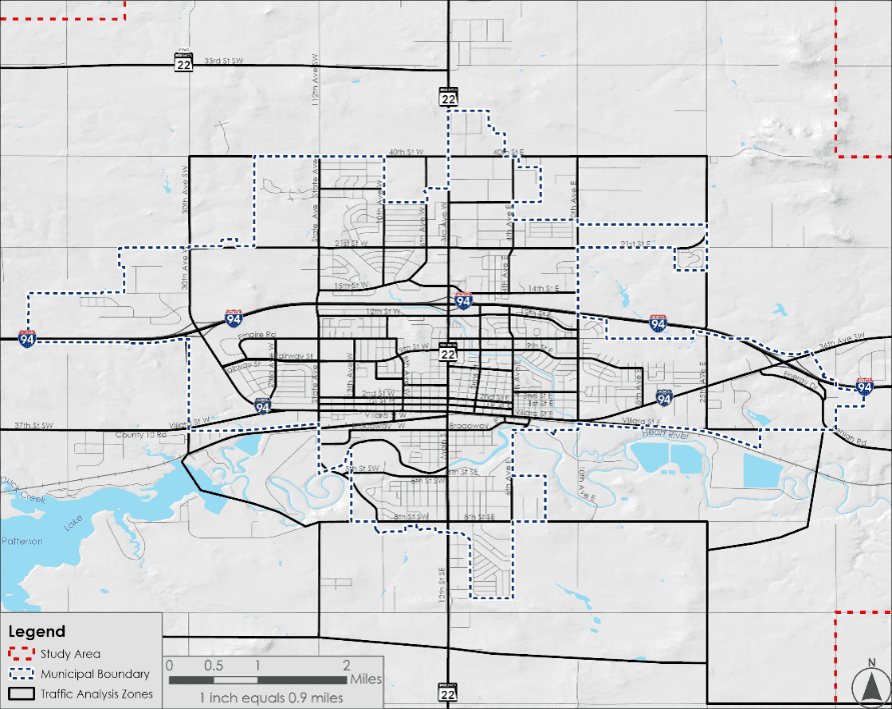
For example, node 2030 was in the southwest quadrant, simplifying navigation. Alongside intersection names and node numbers, we labeled 107 TAZs from the O-D analysis. These census block group zones were further divided by arterials and connectors. Our analysis covered 179 intersections and 107 TAZs.
In addition to census-based TAZs, we incorporated regional highways (I-94, US 10, and ND 22) to balance future vehicle flows. These roadways were crucial for understanding the distribution of residential and commercial/office trips.
Our analysis helped the city determine how commercial development should be complemented by low, medium, or high-density housing to encourage local trips and reduce reliance on external housing or jobs.
Balancing Nodes
With all volume data added, we included balancing nodes on collector roads to reflect existing TAZ volumes from StreetLight. These nodes helped distribute traffic between study intersections based on TAZ magnitude. We ran an initial Vistro travel demand model, analyzing peak-hour intersection operations in Dickinson.
Preliminary results were shared with the city for feedback, allowing us to adjust volumes for newer developments missing from StreetLight data. The final model incorporated these updates for accurate existing conditions.
Initial Land Use Forecasts
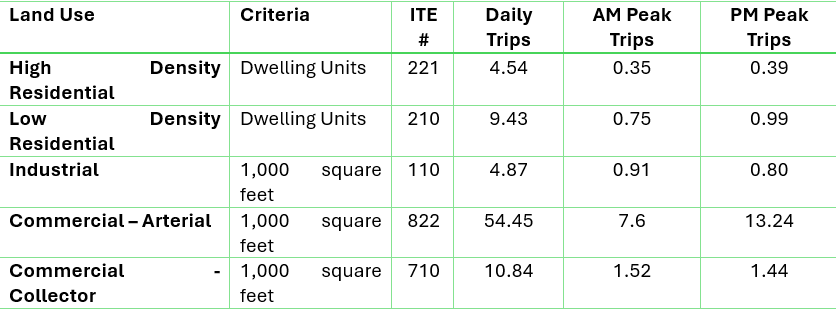
We developed initial land use forecasts for three 2050 scenarios, reflecting varying housing densities and commercial footprints. These forecasts were assigned to vacant parcels based on city input, then aggregated by TAZ. Using ITE Trip Generation rates and parcel occupancy estimates, we generated trip projections for each scenario. Land uses were classified into four categories: high-density residential, low-density residential, industrial, and commercial.
To balance future development, we incorporated regional roadway volume growth into Vistro. ITE TripGen determined traffic generation by land use type and assigned O-D trip percentages. For low-density residential, we assumed each dwelling occupied 25% of its parcel, while industrial and commercial land uses assumed 5% utilization.
Traffic assumptions varied by road type. Arterials followed trip patterns similar to strip retail plazas (ITE Code 822), while connectors resembled office buildings (ITE Code 710). Industrial sites were categorized as General Light Industrial (ITE Code 110). A summary of daily, AM Peak, and PM Peak trips by land use type is shown below.
O-D Trip Matrix
After metro-wide calculations, Scenario A lacked enough residential trips to support Dickinson’s industrial and commercial demand, while Scenario C generated too many, increasing regional job commutes. Scenario B provided the best balance, aligning development growth with regional trip patterns. To refine future trips, we applied a 1.4% annual growth rate on regional highways, matching historical trends.
We created a weighted O-D trip matrix, initially seeded with StreetLight O-D data, and refined it over 60 iterations to balance proximity bias (existing patterns) and magnitude bias (new jobs driving housing demand).
The final trip matrix was assigned in Vistro, calculating shortest routes and future 2050 ADTs from AM and PM model volumes. These ADTs helped identify capacity constraints and ensure collector roads weren’t experiencing excessive cut-through traffic.
Planned projects were integrated into the travel demand model to assess their impact on intersection level of service, shaping Dickinson’s 25-year transportation plan. These projects were identified to address corridor and intersection concerns while prioritizing roadway improvements based on future development potential.
Challenges of Travel Demand Model
We encountered several challenges throughout the project. One key issue was integrating StreetLight Data into GIS while coordinating between planning and engineering teams. Differences in naming conventions across previous TAZs, StreetLight TAZs, and new census parcels required standardizing intersection and ADT segment IDs for better communication. Once Vistro’s detailed data was finalized, other GIS zones could be adjusted accordingly.
Trip generation methodology also evolved. Initially, the study area was divided into six sectors, each containing up to 20 TAZs, with land uses summed at the sector level. However, this approach lacked the detail needed to assess impacts on specific intersections. Retaining detailed land use data for each TAZ improved accuracy and reduced assumptions.
Other challenges included selecting appropriate land use codes, estimating land utilization percentages, and determining future vehicle entry points into municipal TAZs. Despite these complexities, the detailed Vistro model and regular PMT meetings ensured the city’s concerns were addressed, allowing the model to adapt to evolving development assumptions.
Results and Conclusions
The results of the project show that the methodology and software work well for metropolitan areas with populations between 10,000 and 50,000.
The macroscopic Vistro travel demand model provides instantaneous calculations based on changing development assumptions. This model is a flexible tool that the city can adapt over time as specific developments or assumptions evolve within each detailed TAZ.
In addition, we developed an implementation plan that identifies failing corridors and intersections, which the city can use to prioritize projects over the coming decades. This plan helps ensure that funding is allocated effectively as forecasted developments become reality.
Key Performance Indicators (KPIs)
- Model Calibration Accuracy:
Achieved an R² value of 0.9953 after data calibration, ensuring reliability. - Infrastructure Planning Efficiency:
Identified priority corridors and intersections for future upgrades based on congestion forecasts. - Development Impact Assessment:
Enabled city planners to test different land-use scenarios and proactively adjust zoning policies.

Intersection analysis that serves your community
Discover PTV Vistro –
the smart tool for travel demand modeling
White Paper: Transport Modeling
How do you create a transportation model and how are they used? What are the so-called “four steps” of transportation modeling? What is activity- or agent-based modeling? Read this white paper and find the answers to the most important questions.


