

Table of contents
When new housing developments are planned, public transport provision can often be viewed as a concession and without the understanding of would-be residents’ transport needs. Traditionally, planners have relied on spreadsheets to estimate costs and revenues for new bus services and simple accessibility tools to understand which services are within reach. And though that approach provides some insight, it can fall short – particularly for larger developments – where it is important to understand the complex relationships between transport demand, competing modes, accessibility, and network effects.
Transport modelling is used widely to help consider these affects, particularly in relation to demand response – i.e. how many people are likely to use bus versus car? In turn, this can help us choose which bus service option should provide the most sustainable return, both in enabling people to make the journeys they want to by bus, and in ensuring that services are financially viable. Transport modelling however can be a relatively slow and expensive approach, especially when compared to simple spreadsheet models and as such isn’t always used for development planning where turnaround times are short.
The good news? This doesn’t have to be the case anymore. With PTV’s tools – Model2Go and Lines – transport modelling can be much faster and cheaper. This is the story of how we applied these tools to a real-world development and why this approach provides a reliable method for future bus optioneering for new development projects.
The Challenge: Planning for Growth in Banwell, Somerset
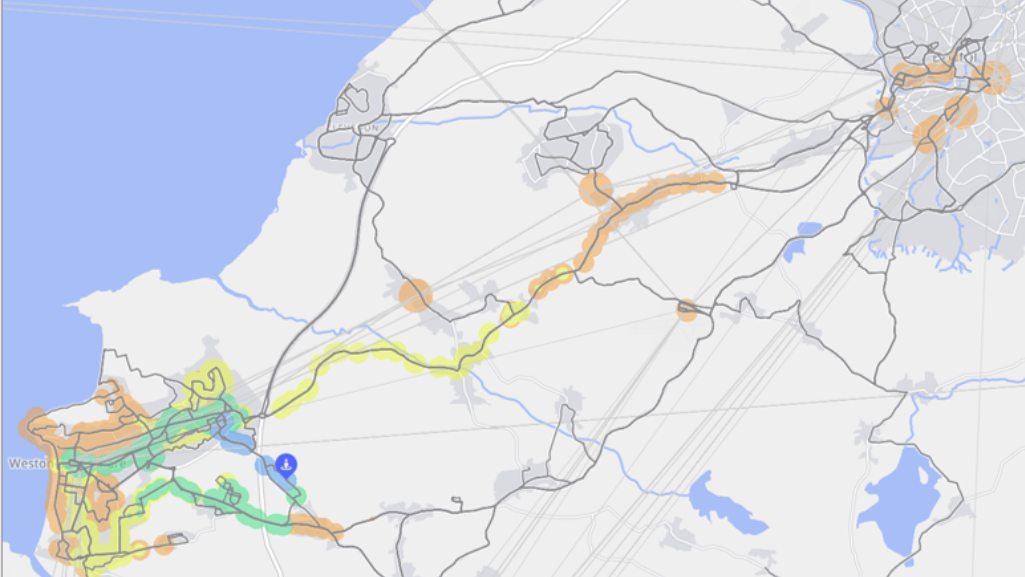
Our case study focused on Banwell, North Somerset, where the development of a new village called Wolvershill is planned. The proposed development will include 1,300 new homes, a local centre, and a primary school. The nearest rail station, Worle, is just two miles away, offering fast connections to Bristol – a major employment hub. The question was simple but critical: how do we design bus services that make this development attractive for residents, yet still commercially viable for operators?

Why Spreadsheets Aren’t Enough
Developers are often required to contribute to public transport services, but how do we decide what’s fair and reasonable? Traditional methods use spreadsheets to calculate costs and revenues, but they ignore:
- Mode shift – how people change travel habits when new services are introduced
- Detailed patronage information – how many people might actually use the service, given people’s demographics, their travel demand considering access to jobs, services, and amenities, and the availability of competing modes?
- Accessibility – how proximity, land use, and transport services interact to fulfil transport needs
Our Approach: Combining Model2Go and PTV Lines
We used two tools in combination to help design and assess potential options:
- Model2Go: A ready-to-use multi-modal transport demand model that reduces a lot of the upfront cost and time of building a model. A detailed road and public transport network is supplemented with demand data to help capture trip patterns across time periods and modes.
- PTV Lines: A web-based bus planning tool that lets you design routes, adjust timetables, and instantly see performance indicators like ridership and operating costs.
This combination allowed us to:
- Design and test service options dynamically
- Estimate demand and revenue accurately
- Assess commercial viability at an early stage
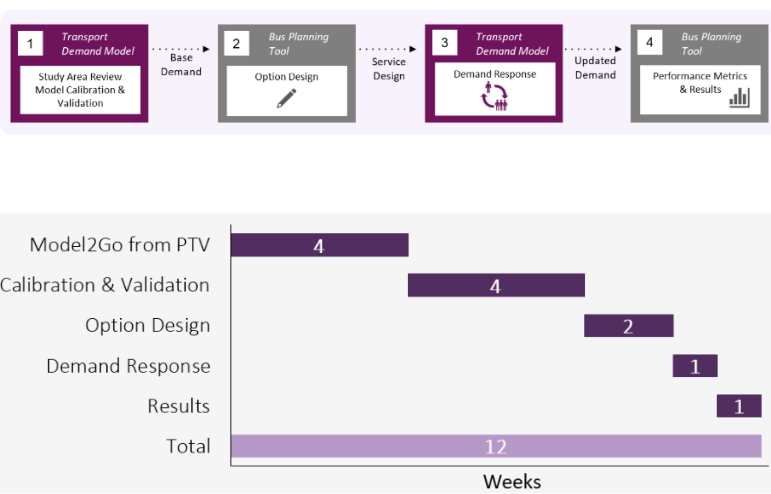
The whole process – from model request, to calibration, option designing, and assessment took only 12 weeks, compared to months (or even years) for traditional modelling. This also translated to a significant cost saving.
Step 1: Building and Calibrating the Model
A Model2Go was provided for the study area and came preloaded with:
- A detailed and realistic road network
- All public transport routes and timetables
- All typical transport model components, including zones and demographic data
- National Trip End Model data to inform trip rates and patterns
- A TAG-style demand model, allowing for the assessment of mode shift potential
We then calibrated the model using local traffic data and validated it against observed journey times across the network. The result? A model that meets industry best practice and reflects real-world conditions – without the cost and time of building from scratch.
Step 2: Designing Options in PTV Lines
Next, we moved to PTV Lines to design two service options:
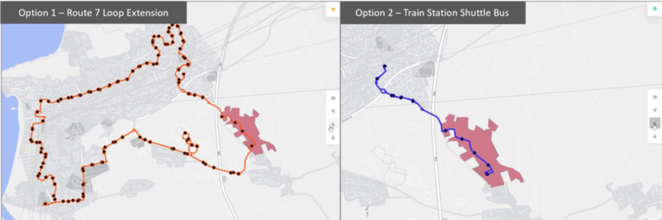
- Route 7 Loop Extension
Extending an existing high-frequency bus route to serve the new development and use the upcoming Banwell bypass (due Spring 2027).
- Shuttle Bus to Worle Station
Introducing a new service linking the development directly to Worle station for fast access to Bristol.
Lines made this design process easy, meaning we could:
- Draw, edit, and design routes – even on roads that don’t exist yet.
- Add or move stops and set catchment areas.
- Quickly design different timetable options and customise with the use of a connections visualiser to ensure that options complement existing services
- Visualise origin–destination demand (e.g., strong flows to Bristol).
- Compare accessibility:
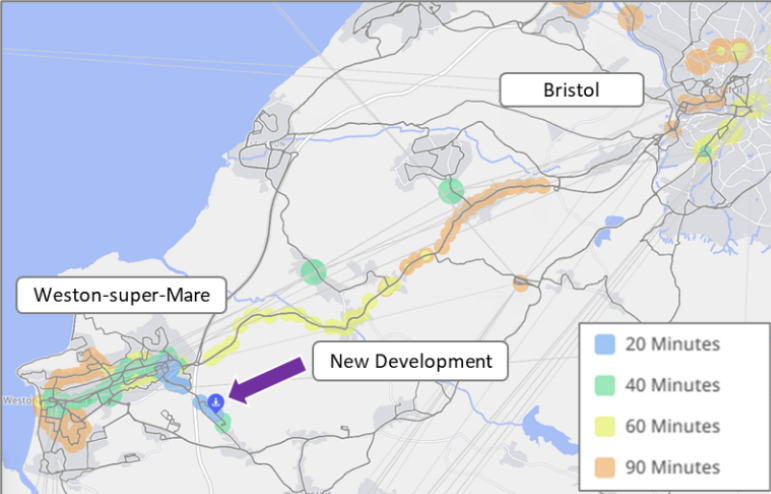
Option 1 which would help improve local access across Weston-super-Mare.
Option 2 offered faster access to Bristol (40 minutes vs. 90 minutes).
Step 3: Testing Demand Response
Once the options were designed, we fed them back into Model2Go to see how people would respond to the new infrastructure. Utilising the variable demand model, this gave us updated patronage estimates considering the new development and the new services. We then pushed this demand back into Lines to calculate performance metrics like ridership, operating costs, and revenue.
Results: Ridership and Viability
Here’s what we found:
| Metric | Option1 – Route 7 Extension | Option 2 – Shuttle Bus |
| Additional Vehicles | +2 | +2 |
| Service Distance (km/week) | +3,500 | +1,800 |
| Forecast Ridership (trips/week) | ~10,800 (additional) | ~9,000 |
| Estimated Income (£/week) | ~£19,500 | ~£16,200 |
| Estimated Costs (£/week) | ~£18,100 | ~£12,100 |
| Potential Profit Margin | ~7% | 34% |
Under current assumptions, the shuttle bus option therefore emerged as the more commercially attractive solution, thanks to lower operating costs and higher revenue per km.
Why This Approach Has Merit
This approach helps design services considering many of the complexities of the real-world, such as convenience of services, accessibility and connectivity to amenities, and demographic factors such as access to a car. This approach therefore provides a balanced view that is beneficial for:
- Residents: Helping to design services that consider need for jobs and amenities, with frequency and convenience that can compete with car.
- Operators or public transport authorities: Being aware of the commercial viability ahead of implementation.
- Developers: Demonstrating evidence-based contributions that stand up to scrutiny.
And, because the model can be retained as an asset, it can be reused for future tests – saving time and money down the line.
And while this approach costs more than a simple spreadsheet, it’s far cheaper than traditional modelling and delivers stronger, defensible results. It also helps with stakeholder engagement providing visual outputs that make it easy for councils, operators, and developers to understand the options and buy into the plan.

Step up your Public Transport Planning Game
Discover our Ultimate Guide to The Best Public Transport Service
Want to learn more about early-stage public transport planning?
If you’re involved in development planning, bus service improvement plans, or local authority transport strategies, this approach can transform how you work.


