
Table of contents
Imagine a city at rush hour. Thousands of passengers are moving through subway stations, boarding buses, and waiting at tram stops. Each of these travelers creates a data point that records their starting location, chosen route, and destination. This collective information, known as ridership data, is the key to more efficient, reliable, and passenger-friendly public transportation systems.
With PTV Visum 2025 – the multimodal mobility planning software – public transport planners now have a powerful tool to import, analyze and use ridership data like never before. Let’s explore how it works and what it means for shaping the future of public transit.
What is ridership data and why does it matter?
Ridership data is the heartbeat of public transportation. It is about understanding how people use public transportation for their daily activities and travel needs. It tracks where riders start their trips, the routes they choose, when they travel, and the stops they use. It can also capture details such as the type of ticket used on the trip – whether someone uses a single ticket, a monthly pass, or a student fare.
This information comes in two main forms:
- Survey Data: Think of an interviewer asking passengers questions like, “Where did you board?” and “Where are you heading?”. While it can provide detailed insights into travel behaviors and preferences, it requires time, planning, and staff, and only captures a snapshot of all passengers.
- Ticket Data: Automatically collected through systems like smart cards or mobile apps. For example, every time someone taps their card to board a bus or to exit a subway station, the system records a check-in or check-out. This data is accurate and abundant but doesn’t always capture every detail of the passenger’s full journey.
Ridership data matters because it reveals patterns, identifies potential issues, and highlights opportunities for improving the network. For city planners and transit operators, ridership data can help in answering critical questions, such as:
- Which routes become overcrowded during rush-hour traffic?
- Which areas might benefit most from adding or relocating bus or tram stops?
- Could overcrowding patterns be resolved by adjusting vehicle capacity, routing, or headways?
PTV Visum 2025: A game changer for public transit
PTV Visum 2025 interprets ridership data and transforms it into practical, visual information, making it easier to plan routes, allocate resources, and improve schedules. It goes beyond crunching numbers – it’s about understanding how passengers use and move through the network and using that knowledge to design more efficient and reliable systems.
Importing Data Made Simple
Take the example of a city’s metro system. With PTV Visum, you can import ticket data from various file types, including database files such as SQLite files. Suppose the system records 10,000 daily check-ins and check-outs. PTV Visum processes this information effortlessly, identifying entry and exit points and preparing it for analysis.
Survey data works just as smoothly. For instance, let’s say planners conducted a survey on Line 1 buses to better comprehend how passengers are using the service. As the data is imported, PTV Visum creates a list of datasets, each one representing a trip with an origin and a destination. The software handles both: direct trips and those with multiple legs – even if different transport modes are used. Custom attributes, such as ticket types, are also processed, and can be used for deeper analyses.
Turning Data into Actionable Insights
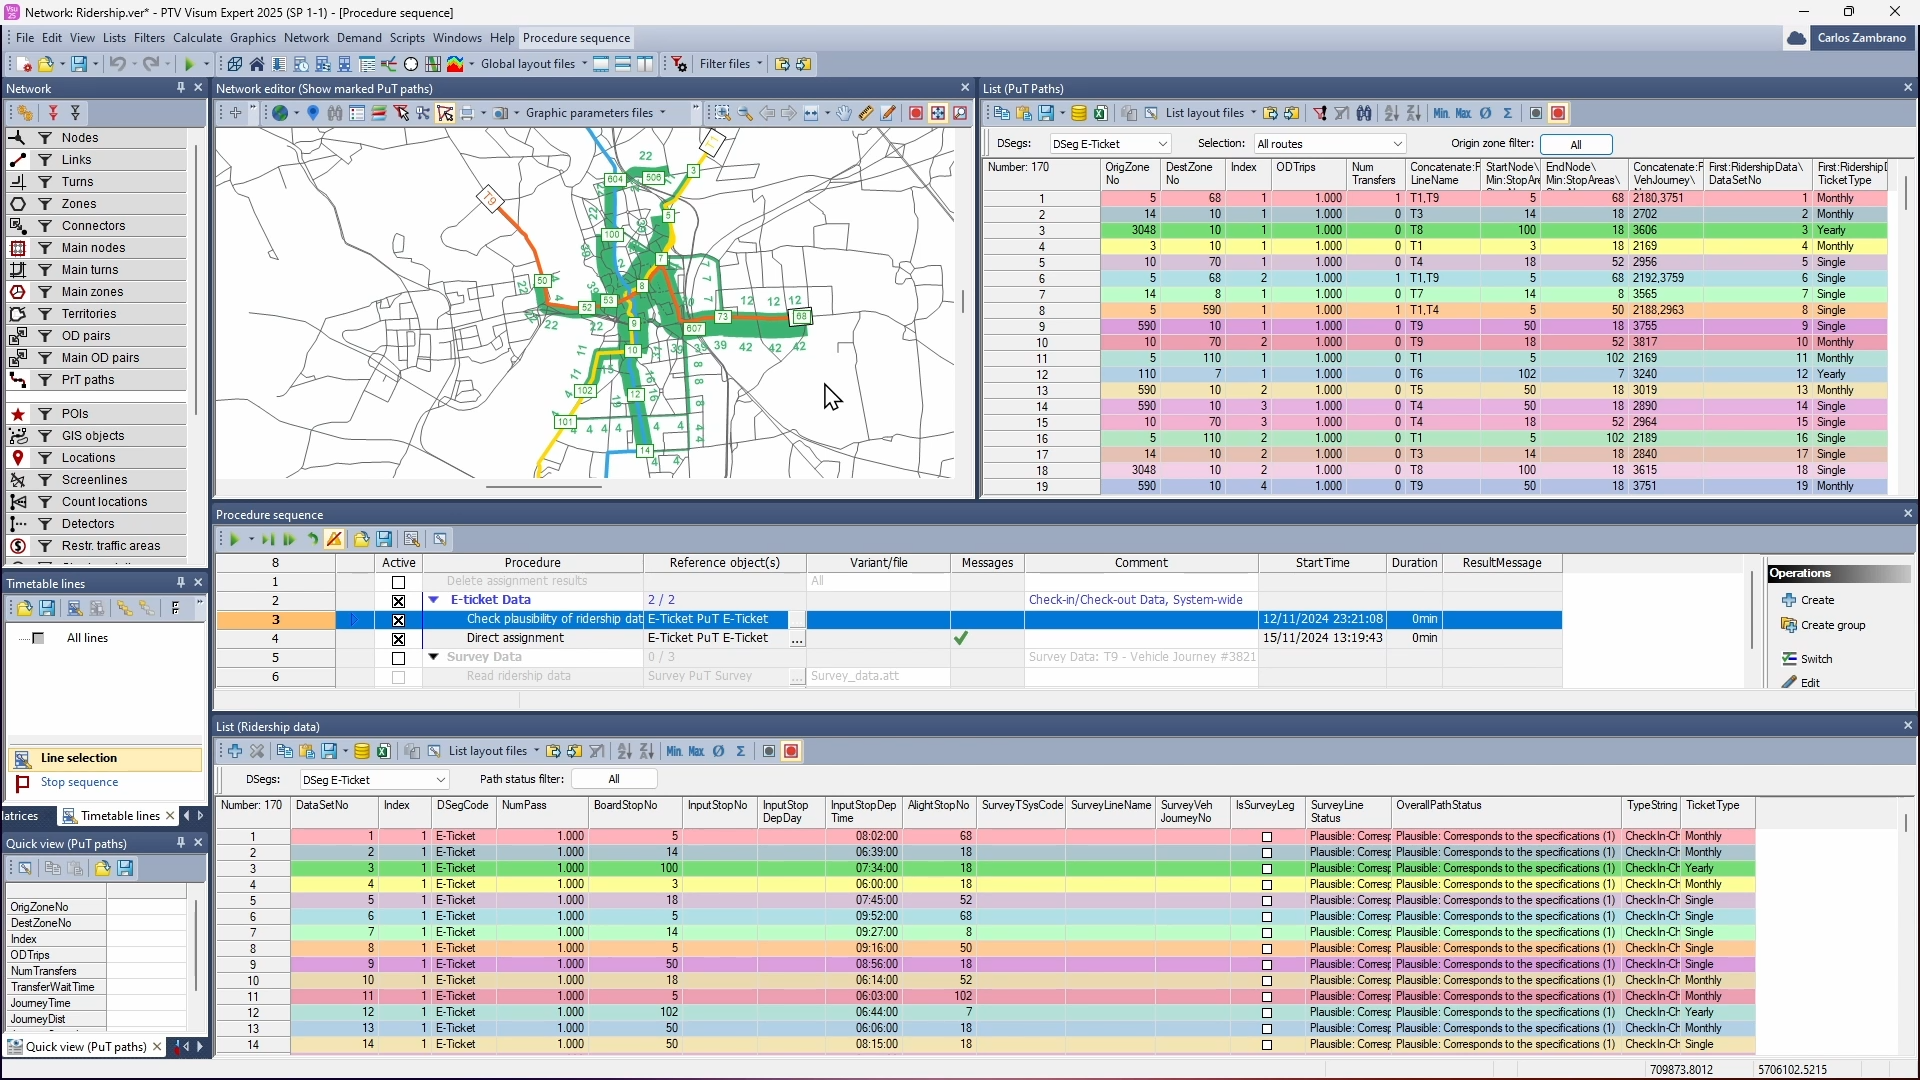
Here’s where PTV Visum’s capabilities shine. After importing the ridership data, the software performs a plausibility check to verify its reliability and alignment against the modeled timetable.
For example:
- A passenger checks in at Station A and checks out at Station C using a ticketing app. But how did they travel? Which bus or tram route did they take?
- PTV Visum calculates the most likely path by evaluating possible transfers, routes, and timetables.
By validating this data, planners gain confidence that their analysis reflects real passenger behavior.
From ridership data to better transit systems
Once the data is processed, PTV Visum assigns it to network objects – like links, stops, lines, or vehicle journeys. This assignment enables planners to explore specific questions. Here are some examples:
- How crowded are buses on Route 5 at 8 a.m.?
A visualization might show overcrowding on certain sections, prompting the addition of more vehicles during peak times. - Where are monthly ticket holders traveling?
Filtering the data reveals patterns unique to frequent commuters, helping tailor services to their needs. - Do weekend travel patterns differ from weekdays?
Displaying ridership by day of the week can show whether certain lines are underused on Saturdays and Sundays, suggesting opportunities for more efficient weekend scheduling.
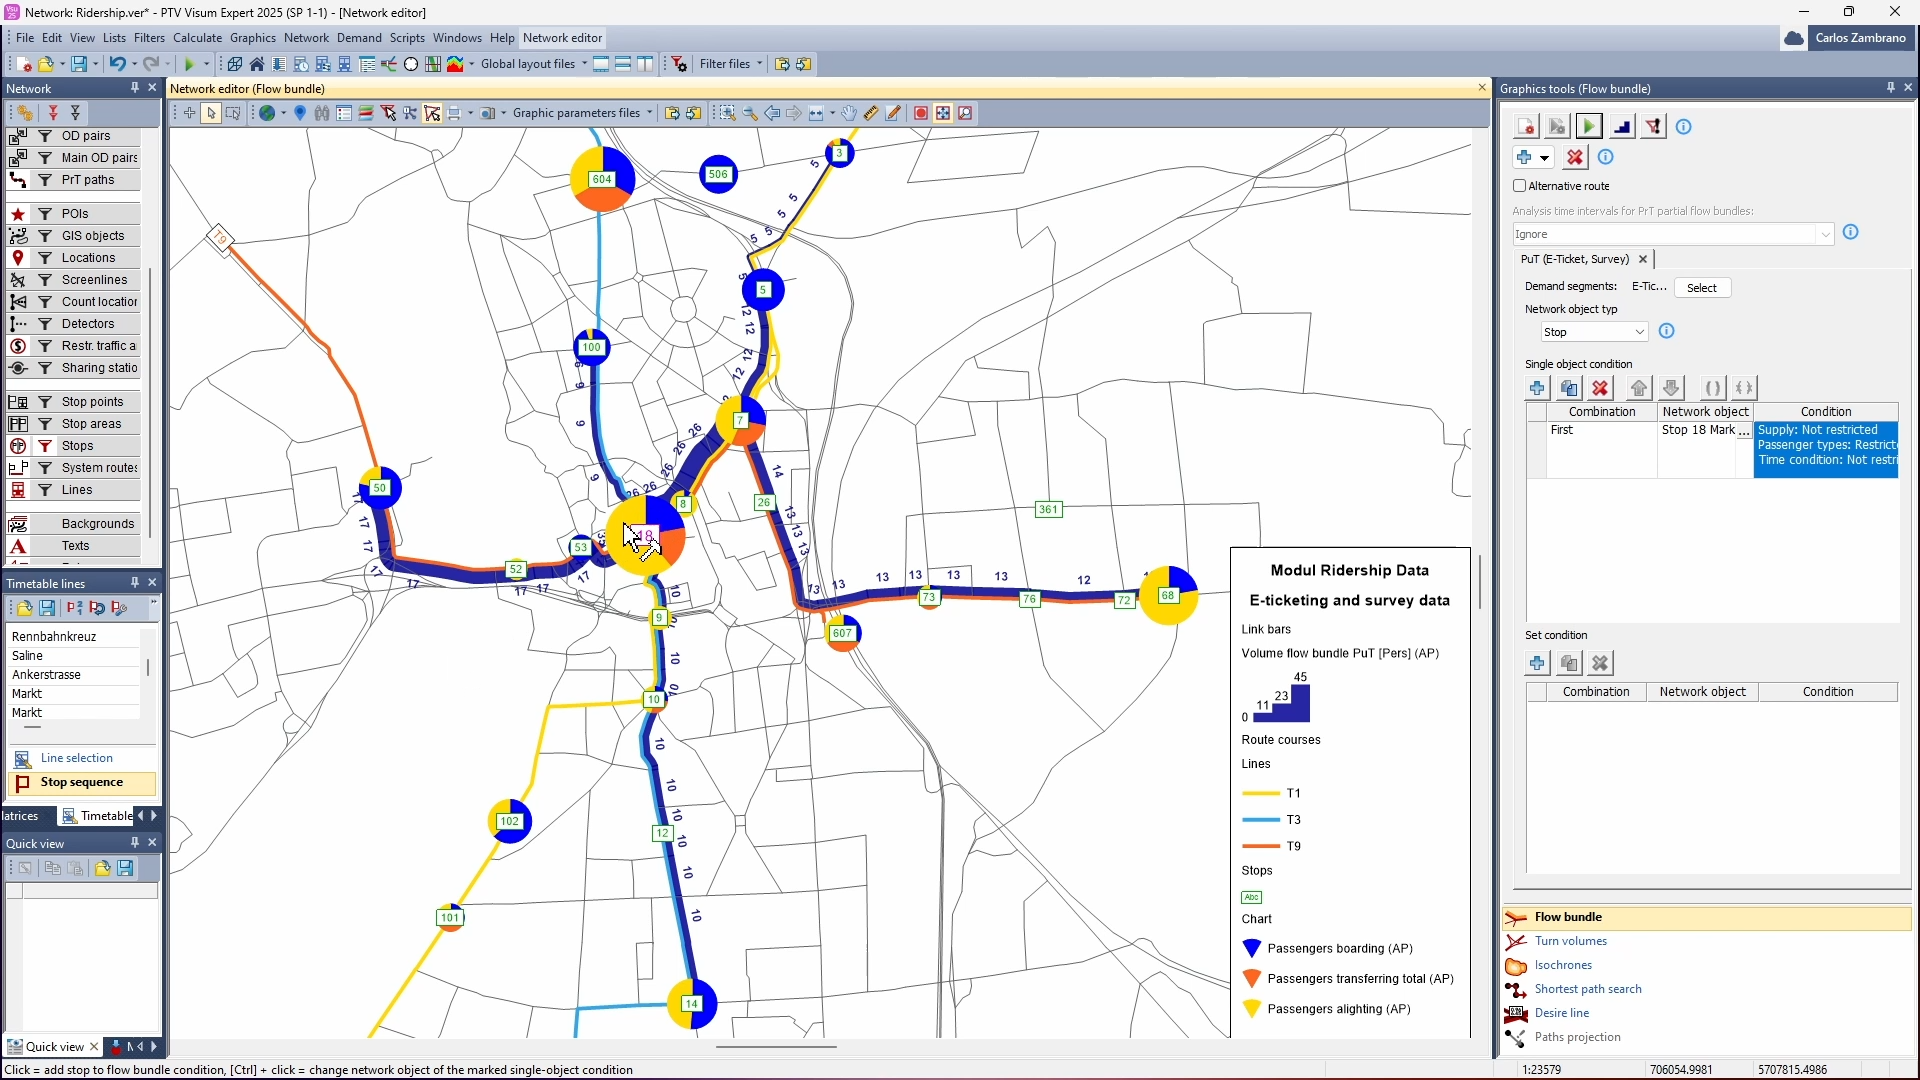
One of PTV Visum’s most powerful tools is flow bundle analysis. For example, if a large number of passengers get off at the city’s central bus station, flow bundle analysis can track where they started their trips. This helps planners identify neighborhoods that may need more bus routes or better service to ensure that everyone has reliable access to public transportation.
Practical applications, real impact
Consider this scenario: A city’s tram system was struggling with overcrowded trams during the morning rush. By analyzing ridership data in PTV Visum, planners found that a tram stop near a busy university consistently has high boarding numbers. By reallocating trams and adjusting schedules, they reduced overcrowding by 20% and improved passenger satisfaction.
In another city, planners used ticket data in PTV Visum to identify bus routes in areas where demand was noticeably increasing but were still underutilized. To better match service with rising demand, they replaced large, infrequent buses with smaller, more frequent shuttle services on these routes. This adjustment increased ridership by better matching service frequency to demand and increased passenger satisfaction.
Why PTV Visum 2025 is essential for public transportation
PTV Visum 2025 uses ridership data to help planners optimize routes, schedules, and resource allocation. By verifying data accuracy and providing insightful visualizations, it boosts operational efficiency, improves passenger satisfaction, and supports informed, sustainable transit planning.
- For passengers: It means shorter waiting times, less overcrowding, and more enjoyable travel experiences.
- For operators: It’s about running services where they’re needed most and optimizing resources through accurate data analysis.
- For cities: It paves the way for sustainable, data-driven mobility solutions, which optimize overall urban mobility and improve the quality of life for residents.
Shape the future of public transit
Ridership data is more than numbers – it’s the voice of the passengers who rely on public transportation every day. With PTV Visum 2025, transportation professionals can listen to that voice and respond with smarter, better transit systems.
Are you ready to revolutionize public transportation planning? Dive into the latest features of PTV Visum 2025 by watching my full webinar about it!

Easily use
ridership data with
PTV Visum 2025
Optimize public transportation planning with the latest version of Visum
Easily use ridership data with PTV Visum 2025
Optimize public transportation planning with the latest version of Visum


