
Table of contents
For Automated Public Transport Network Design, here is a review of the new Line Construction Procedure in PTV Visum software.
What is public transport network design?
Network design is the first step in the planning process for public transport systems. The input is the existing infrastructure – such as roads or railway lines – potential stops, and passenger demand. The output is a basic route concept that defines the structure of the network: the lines themselves, the stops they serve along their routes, and the headways (i.e. the intervals at which services run).
This step forms the basis for all subsequent planning stages, including timetabling, vehicle scheduling, driver scheduling and, ultimately, the actual operation of the public transport network.
Because it sets the framework for all subsequent planning steps, network design has a significant impact on operating costs, passenger satisfaction and the overall efficiency of the public transport system. It therefore needs to be carried out thoroughly, using both human expertise and scientific methods.
This is where the automated public transport network design process comes in – as a powerful idea generator to help planners creating effective and efficient route concepts.
What is Automated Public Transport Network Design?
The aim of Automated Public Transport Network Design is to provide solutions based on empirical data and optimisation techniques, while encouraging out-of-the-box thinking. This approach is not intended to replace the expertise of the planner, but rather to complement it by generating additional ideas and concepts during the design phase.
Designing an entirely new public transport network from scratch is not an everyday task. However, planners often need to partially reorganise the network in different situations, such as:
- Road works or other infrastructure constraints force changes to existing routes.
- New infrastructure – such as a metro extension – that requires adjustments to feeder bus lines in the area.
- A new residential or commercial area needs to be connected to the existing network.
- Changes in demand require updates to the current route concept.
- Specialised services, such as night or weekend buses, may need to be introduced to meet specific mobility needs.
- Changes to travel patterns, especially when the traditional home-to-work commute no longer dominates ridership.
- Events, holidays or vacation periods temporarily change or increase passenger demand.
Line Construction Procedure and principles
Now let’s see how PTV Visum can help you with this task through the new Line Construction Procedure, which takes an explorative approach to network planning. It uses a genetic algorithm, which is essentially a trial-and-error search algorithm. The algorithm consists of five stages.
In the first step, we generate a large set of potential lines – the line pool. Next, we assign demand to these lines. Then, in an iterative loop, we select subsets of lines, assign a demand to each, and evaluate the resulting selection. This process continues in a loop until we can no longer improve the solution.
A key feature of this algorithm is that it not only identifies the best solution, but also provides many good but different alternatives. For this reason, we have integrated line construction into the Scenario Management framework.
Scenario Management
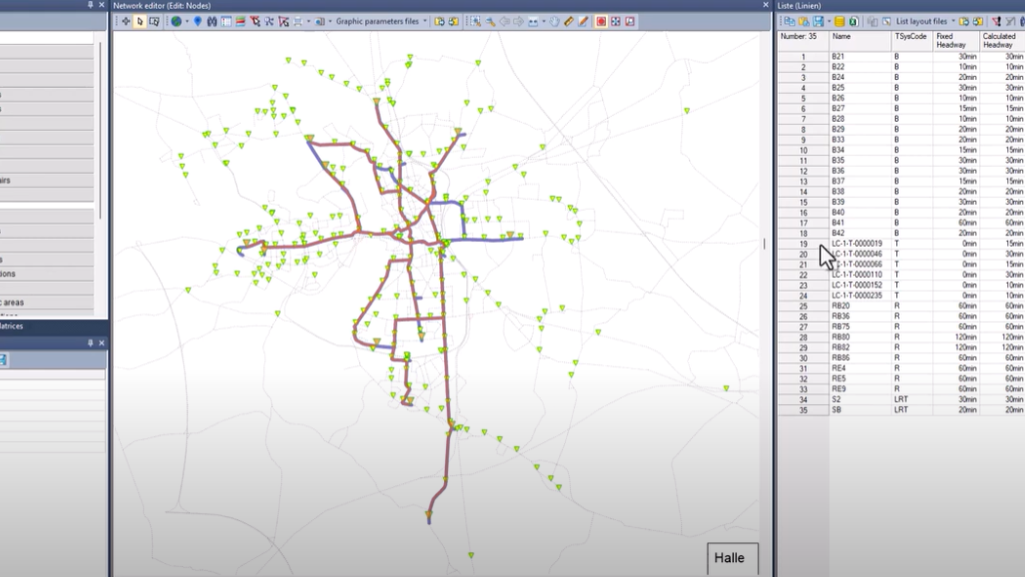
In the base scenario of the Visum Scenario Management project, we start with a network that includes nodes, links, stops and zones. We want to create the tram lines in such a way that they form a useful transit network together with the existing bus and regional train lines, which are considered unchangeable and are also included in the base scenario. Terminal points are predefined, the latter marking where new tram lines can realistically start or end due to the required infrastructure (e.g. loop). Demand is represented by matrices that can be visualized by desire lines.
Procedure parameters
Next, the user sets up the procedure parameters for line construction in Visum by selecting a scenario and opening the corresponding dialog. They can choose to run the full procedure or individual phases, define fixed lines based providing their respective headways, and configure key iteration settings like the number of solutions per iteration and the stopping criteria. These parameters guide how the system generates, evaluates, and selects line configurations within the network.
Transport systems
In the Transport Systems section, the user selects which transport modes to include and provides basic vehicle parameters such as capacity and available fleet size. They also define end points to indicate where lines may begin or end, and set minimum and maximum detour factors to control how much route deviation is allowed during line construction. These settings help to determine the feasibility and flexibility of the generated tram routes.
Assignment parameters
In the Assignment Parameters section, users select demand segments and a demand period, assuming that demand is evenly distributed over this period. It’s important to avoid using public transport assignment matrices derived from models or observed ridership, as these already reflect travellers’ responses to the existing line configuration and may bias the results. Instead, users should rely on demand data prior to mode choice or use a combination of public transport and car matrices to ensure more objective and innovative route planning.
Objective function components
The Objective Function evaluates the quality of a line concept using multiple criteria that reflect traveler and operator perspectives as well as the interests of the public authorities: diversion factors, transfers, capacity violations, vehicle usage, service levels and unserved passenger miles. Planners can assign weight factors to prioritize these objectives based on their specific planning objectives. Since some objectives conflict, such as minimizing capacity violations versus reducing empty seat time, planners must carefully balance trade-offs to effectively guide decision making.
Results output
The final page defines how results should be displayed, including where to place the calculated headway in the resulting line set and how many good solutions to show. It emphasizes that multiple solutions may exist, including pareto-optimal ones, which will be explained later.
Example of Line Construction Procedure
The Line Construction Procedure in Visum begins with building and allocating lines, progressing through iterations until no improvements are found over 50 generations, at which point multiple solutions – including best, near-optimal, and Pareto-optimal – are generated.
These solutions are evaluated against key performance indicators like capacity violations, vehicle usage, and unmet demand. While the best solution minimizes the overall objective score, alternative scenarios offer trade-offs, helping planners balance efficiency and service quality.
Planners can further tailor scenarios by adding constraints such as minimum service frequencies at specific stops, prompting the system to update the network accordingly. Additionally, specific lines can be fixed as structural backbones, allowing the network to evolve around them while maintaining strategic continuity and alignment with planning goals. In this segment, we demonstrate the Line Construction procedure in a tram network. Watch how this is done:
Reacting to changes in demand
In this last application, the planner simulates a change in passenger demand by modifying the demand matrix and then recalculates only the headways, leaving the existing routes unchanged. This targeted approach generates new solutions where the line structure remains unchanged, but the headways are adjusted to better match the (updated) demand, ensuring operational efficiency without changing the network layout.
Comparing line concepts
To compare line concepts created by the Line Construction procedure with imported or manually created scenarios, you can use PTV Visum’s built-in procedures, such as headway-based assignment and PT operating indicators, to calculate similar skims. By applying a customized set of procedure parameters, these metrics (e.g., number of transfers, unserved demand, travel time) become available for all scenarios, enabling consistent comparison and visualization, including standard volume bars on the network. This allows for meaningful evaluation even when the objective values from Line Construction aren’t directly available for individually created scenarios.

Step up your Public Transport Planning Game
Discover our Ultimate Guide to The Best Public Transport Service
Optimize your public transport network design
PTV Visum’s automated network design generates better routes, with less effort and more flexibility
Related Posts


