Table of contents
For transportation and urban planners, accessibility analysis is key to creating inclusive and equitable mobility. As cities grow and diversify, planners must ensure that all residents, regardless of age, income, or ability, can access essential services and opportunities. PTV Visum, the leading transportation planning software, offers robust tools for analyzing and visualizing accessibility. As a result, professionals can make informed decisions that promote fairness in mobility systems.
This article dives into the fundamentals, methodologies, and technical setup of accessibility analysis in PTV Visum, using a detailed case study of the Greater Austin area as an example.
Note: The article is based on episode 5 of PTV Talks – Spotlight Series.
What Is Accessibility in Transport Planning?
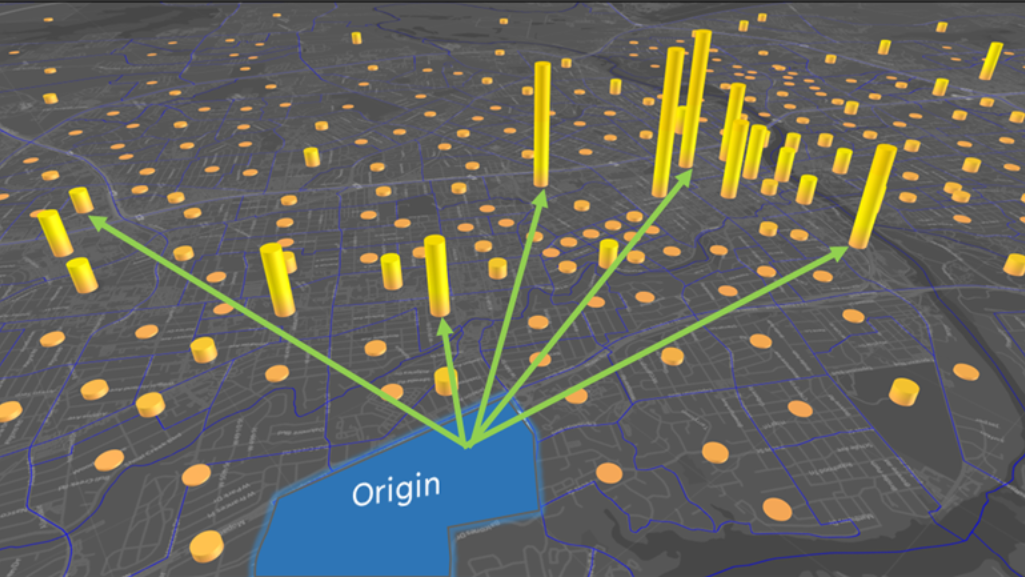
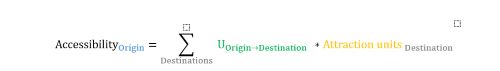
In the context of mobility, accessibility refers to the ease with which people can reach desired destinations, such as jobs, schools, hospitals, and other services. Technically, accessibility is defined as the number of attraction units (e.g., jobs, university seats, or hospital beds) that can be reached from a given zone, weighted by the desirability or acceptance of associated travel.
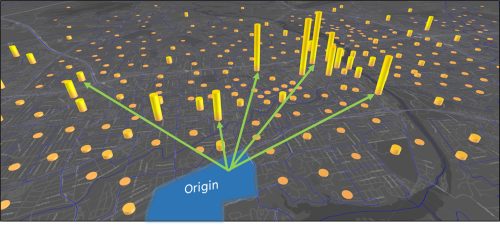
For example, the number of jobs reachable within a 30-minute commute from home reflects a person’s access to employment opportunities. Importantly, accessibility is not solely about travel time or distance; it can also consider comfort, affordability, and safety.
Why Transit Accessibility Analysis?
Public transportation is central to accessibility analysis because it serves a broad population, including people who cannot or choose not to drive. Children, seniors, and individuals with limited financial resources often depend on public transportation. Improving transit accessibility promotes social equity by offering everyone the same opportunity to access essential services and opportunities.
Furthermore, encouraging shifts in transportation mode from private vehicles to public transit contributes to environmental sustainability. It reduces infrastructure costs, which further supports equitable growth.
Utility: Measuring Travel Acceptance
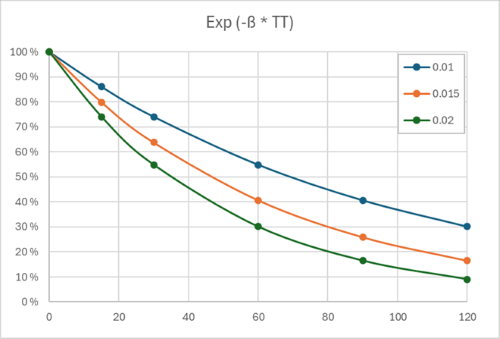
Accessibility calculations in Visum are based on a utility function representing travel acceptance. This function reflects how likely people are to consider a trip “desirable” based on impedance factors, such as travel time. The utility function is typically modeled using an exponential decay function:

Where:
- Uij is the desirability (utility) of travel from origin i to destination
- Impij is the difficulty (impedance) of travel from origin i to destination j
- β\beta is a sensitivity factor (calibration parameter)
For example, a β value of 0.015 might indicate that 80% of users would accept a 15-minute trip, while only 40% would accept a 60-minute trip. The steepness of this decay curve changes with β, so it must be selected carefully, either by referencing similar regional models, conducting surveys, or analyzing available travel data.
Importantly, impedance isn’t limited to time alone. It can also account for cost, physical effort, safety, or discomfort (e.g., overcrowding or poor station conditions).
Accessibility Results
PTV Visum supports two main methods of visualizing accessibility:
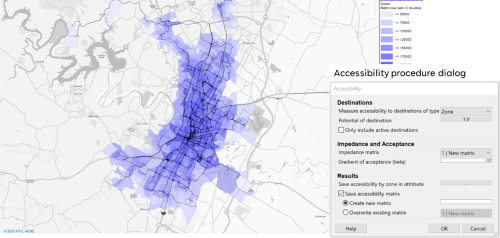
1. Accessibility Mapping
Each zone is color-coded based on the value of accessibility (total number of attraction units (e.g., jobs) weighted by travel utility). The result is a continuous, visually intuitive map that highlights spatial disparities in opportunity.
In Visum, users can:
• Select the data layer representing attraction potential
• Choose the impedance matrix (e.g., perceived journey time).
• Enter the β factor.
• Save results as scalar values per zone or in matrix format for deeper analysis.
This method is ideal for comparing neighborhood accessibility and identifying underserved areas.
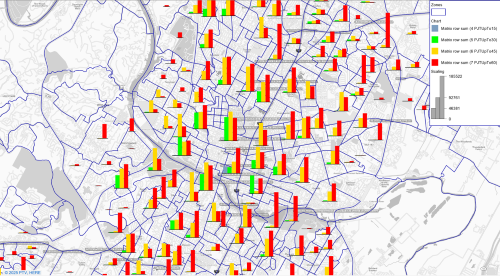
2. Travel Time Class Analysis
This approach classifies accessibility into defined travel time intervals (e.g., jobs reachable within 15, 30, 45, or 60 minutes). For each zone, planners can create a table or graph showing the number of reachable jobs in each time class.
Although less visually striking, this method provides clarity for numeric comparisons and supports reporting and benchmarking. It complements the aggregate method by providing more tangible and easier-to-interpret results in policy contexts.
Comparing Analysis Methods
To provide context for accessibility analysis, it’s helpful to compare it with two other methods:
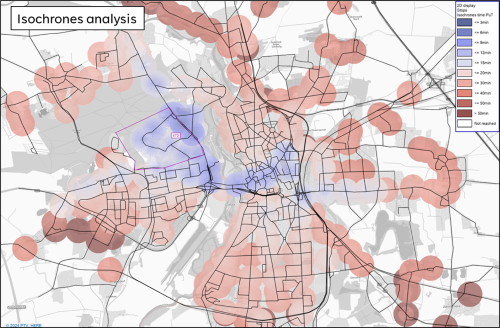
- Isochrone analysis: This method shows travel time from or to a single point, but it ignores land use at the origin or destination.
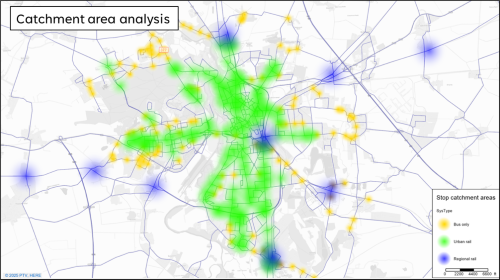
- Catchment Area Analysis: Focuses on service areas around stops or stations, but does not consider travel time or connectivity.
By contrast, accessibility analysis combines the spatial dimension of land use with network performance, offering a more holistic view of mobility equity as a complement to the other two methods.
Model Setup in PTV Visum
There are several key steps to setting up an accessibility model in PTV Visu:
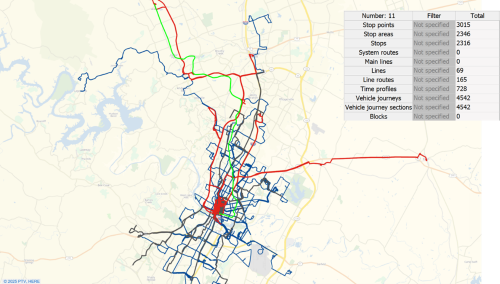
1. Data Collection: For the Austin case study, which I presented in the webinar (from 08:05), population and employment data from the U.S. Census Bureau was used, along with GTFS feeds from the local transit provider (CapMetro).
2. GTFS Import: GTFS data is imported into Visum, creating a blank model with all transit lines and schedules. Care must be taken to correctly configure calendar periods.
3. Transit Network Integration: When multiple operators exist, their GTFS data must be merged. Visum’s public transport supply import dialogue helps combine these datasets into a single, functional model.
4. Network Simplification and Walk Links: To ensure a realistic model, redundant network elements are consolidated and walking networks from OpenStreetMap are merged to simulate pedestrian transfers.
5. Zone Connections: Zones (e.g., 1,800 census block groups) are connected to the network using PT connectors. This can be done via built-in methods or custom add-ins.
6. Impedance Matrix Setup: Travel times are adjusted to reflect perceived difficulty, e.g., walk times are tripled, and 10-minute penalties are added per transfer. These adjustments influence the impedance matrix used in utility calculations.
7. Running the Analysis: Once all components are in place, the accessibility matrix is computed. Then, the results can be visualized using the above-described methods, which enables planners to identify mobility gaps and opportunities.
Conclusion
Accessibility analysis in PTV Visum enables transportation professionals to design more equitable and efficient transit systems. By quantifying how easily people can access essential services and identifying gaps, this approach ensures that infrastructure investments deliver inclusive benefits. Whether visualized through detailed maps or tabular comparisons, accessibility metrics are essential for data-driven mobility planning.
As cities continue working on inclusiveness and smart development, accessibility analysis will remain essential to transport planning. With tools like PTV Visum, planners can better shape a future where opportunity is within reach for all.

Can an accessibility analysis improve your city?
Explore powerful tools that assess mobility measures and help people travel
Improve your city with accessibility analysis
Explore powerful tools that assess mobility measures and help people travel.
Related Posts


