
Table of contents
- E‑bus Planning isn’t Plug‑and‑Play
- Operational Gaps Exposed by Simulation
- Depot Power Peaks Require Early Modelling
- Authorities vs. Operators: Different Planning Needs
- Simulating Infrastructure Options
- Comparing BEBs and Hydrogen with Simulation
- Lessons for mobility planners
- Conclusion
- Download the Public Transport Playbook for free
Some transportation operators and authorities begin their e-bus planning assuming that battery-electric buses (BEBs) can easily replace diesel buses. However, once an electric bus simulation of a full operational day is run, this assumption quickly collapses.
Mixed fleets disrupt established schedules and charging windows conflict with service patterns. What looked feasible on paper suddenly requires additional vehicles or new infrastructure.
This article will highlight how simulation enables planners to address most of these issues in advance by redesigning blocks, adjusting charging strategies, and validating depot capacity before committing any funds.
[The article is based on our online webinar: PTV Visum | How to model and evaluate the use of carbon-emission-free powertrains]
E‑bus Planning isn’t Plug‑and‑Play
Diesel fleets operate on stable blocks that have been refined for years. However, in e-bus planning, these blocks break down when real operating conditions are considered, such as temperature, topography, auxiliary loads (e.g., heating and cooling), and limited charging opportunities. That is why detailed electric bus simulations form the foundation of every project we deliver.
In our workflow, we combine timetable data, the road network, and a digital elevation model using PTV Visum. Then, we use a Python-based add-on to compute the precise energy consumption for each vehicle journey. This calculation incorporates heating/cooling demand, vehicle weight, efficiency, and recuperation from braking on downhill sections.
The result is a granular, physics-driven energy profile that reveals a fleet’s true capabilities, not just the promises made in OEM brochures.
Operational Gaps Exposed by Simulation
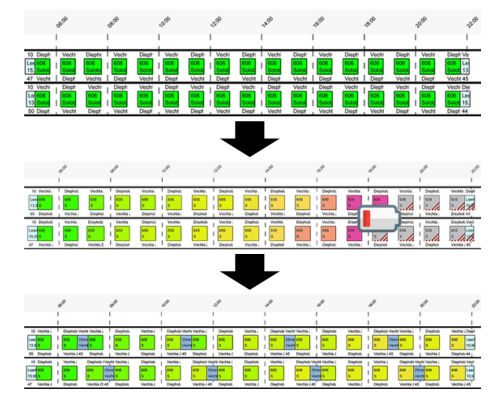
When the authorities send us timetable data without blocks, we generate them in Visum and test their feasibility with BEBs. In one case, the initial mixed-fleet operation required two additional vehicles because the BEB range constraints forced midday recharging breaks, which disrupted the diesel-optimized blocks. After reblocking with charging in mind, however, the 100% BEB scenario ran without additional vehicles because the operational plan matched the technology.
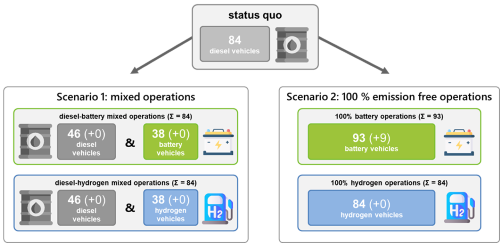
A citywide example from Pforzheim, a city in southwestern Germany, highlights the same challenge. The diesel baseline was 84 buses. A mixed fleet using diesel and BEBs or diesel and hydrogen also required 84 buses. This was achieved using Visum optimization and visualization.
Lesson for planners: It is far cheaper to reblock on a screen than to fix operations after procurement.
Depot Power Peaks Require Early Modelling
The second major challenge in e-bus planning is the energy infrastructure. If every bus were to charge at full power upon arrival, it would create huge peaks.
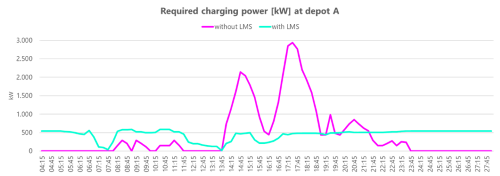
One study found that unmanaged charging created a necessary charging power peak at the depot of nearly 3,000 kW. However, managed charging, modeled using Visum export data and a downstream energy tool, reduced this figure to approximately 550 kW. This difference can significantly reduce the cost of electrification.
Lesson for planners: Simulate the depot load curve early, or risk unnecessary grid upgrades.
Authorities vs. Operators: Different Planning Needs
Since authorities often only provide timetable data, we must build blocks and test several fleet compositions to find viable e-bus planning scenarios. Operators tend to provide fixed diesel blocks and want them to change as little as possible.
Without simulation, BEBs often “go flat” by early evening, unless charging breaks are inserted or the blocks are redesigned. Visum precisely exposes the hidden dependencies that make or break a fleet transition.
Simulating Infrastructure Options
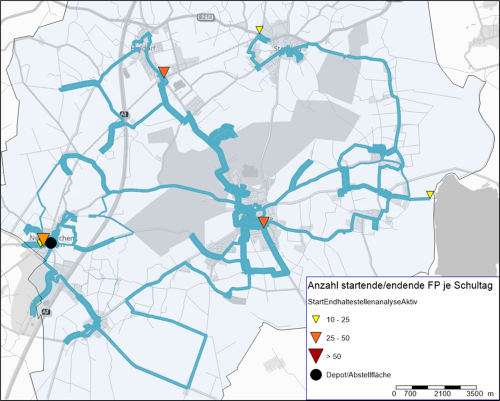
In e-bus planning, new depots or terminal chargers should be located where vehicle movements, dwell times, and power availability align.
Visum helps identify promising areas, such as terminal stations with many start/end events or corridor clusters where several line bundles converge. While the model does not decide on the final parcel of land, it helps identify good areas for infrastructure.
Comparing BEBs and Hydrogen with Simulation
Hydrogen buses often fit existing blocks more easily thanks to their range and refueling speed. However, BEBs frequently win on total cost – vehicle price, infrastructure, and energy.
This combination leads to the choice of battery-electric buses despite hydrogen’s operational advantages. Simulation makes these tradeoffs transparent, grounded in real network behavior rather than assumptions.
Lessons for mobility planners
- Integrate topography and temperature early. Range drops sharply under hills and HVAC loads – never rely on nominal values.
- Expect to reblock mixed fleets. Diesel optimized schedules rarely transfer cleanly to BEBs.
- Simulate depot load curves before designing infrastructure. Smart charging dramatically reduces peak demand.
- Compare BEB and hydrogen scenarios with electric bus simulation. Let the model – not assumptions – reveal the right technology for your network.
Conclusion
E-bus planning involves more than just replacing vehicles. It requires redesigning the entire system – including vehicles, schedules, charging, and depots.
Electric bus simulation in Visum reveals those dependencies before they result in delays, cost overruns, or political setbacks.
The sooner you start simulating, the more you’ll save.

Public transport planning – from analysis to implementation
Master the challenges of modern transit networks
Download the Public Transport Playbook for free
Related Posts


