
Table of contents
The ability to plan, evaluate, and adapt infrastructure at scale depends increasingly on access to precise, high-resolution data. At Whitman, Requardt & Associates (WRA), we’ve seen firsthand how integrating Big Data with the Umovity Suite transforms large-scale transportation planning from conceptual to operational. In this article, we walk you through our experience using this approach on a corridor project along I-79 in southwestern Pennsylvania.
This article is based on episode 2 of PTV Talks – Spotlight series.
Why Big Data?
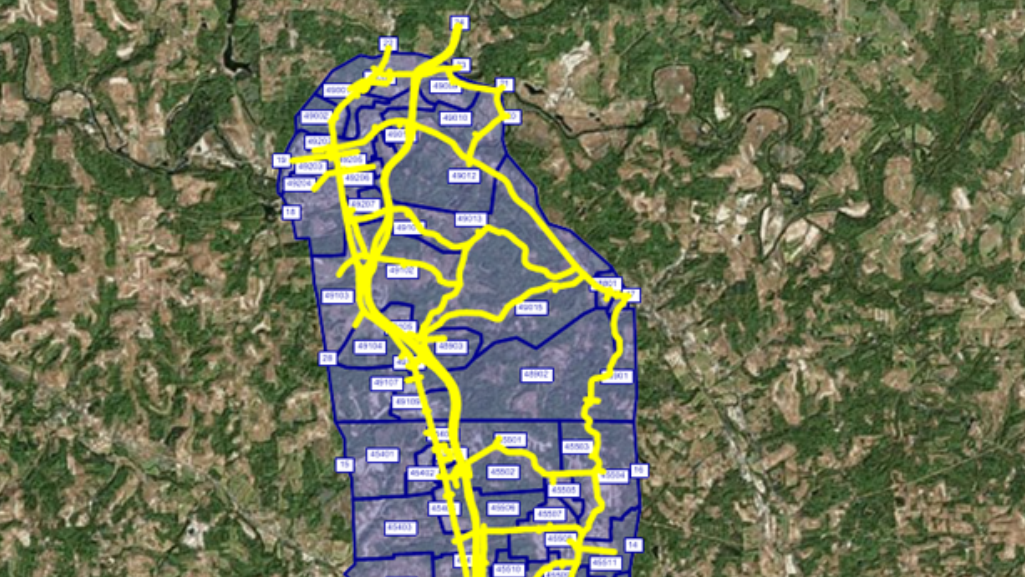
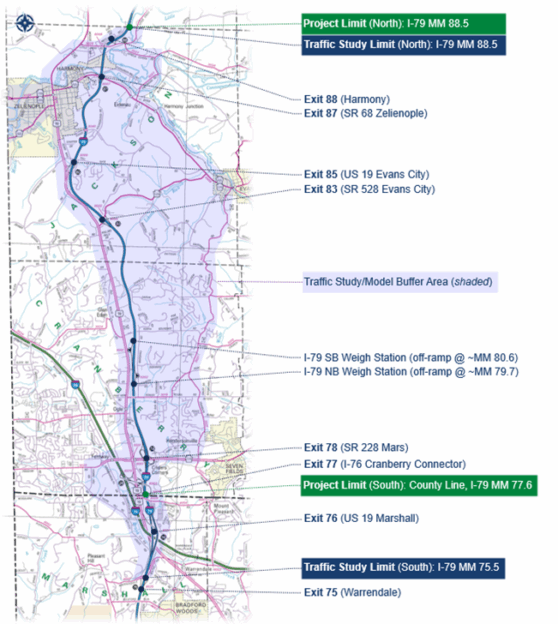
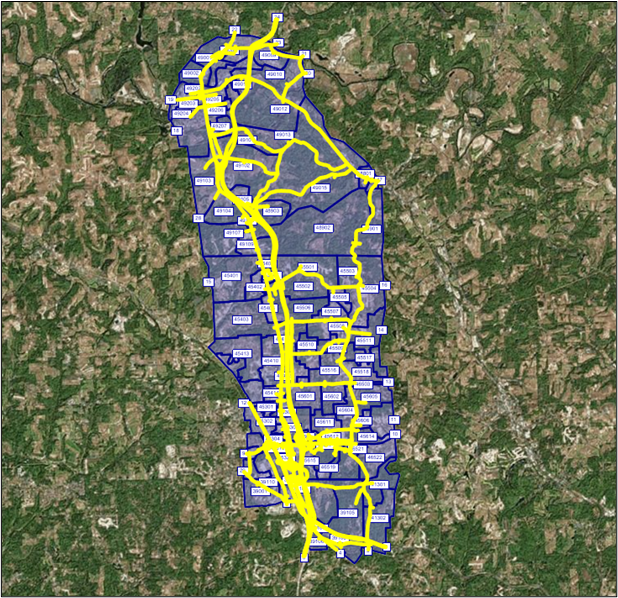
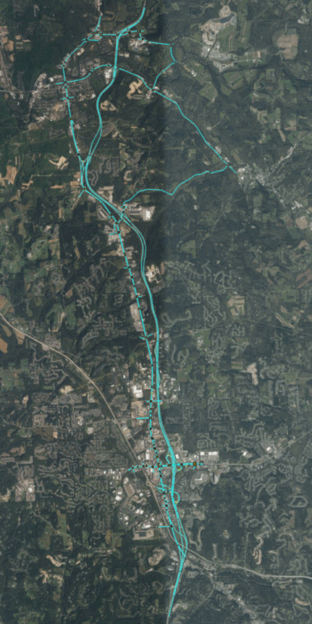
Our project focused on a 11-mile stretch of Interstate 79 through Butler and Allegheny counties. This section included seven interchanges and 56 signalized intersections, 16 of which were managed by adaptive signal control in Cranberry Township.
Our primary objective was to evaluate the feasibility and potential impacts of highway widening and interchange upgrades.
Additionally, we developed our model with the following key advantages that position it well for potential signal retiming and incident management applications:
- Vissim model running Dynamic Traffic Assignment (DTA)
- Required for vehicle path choice along parallel facilities for freeway and interchange alternative analysis.
- Required for incident analysis for accurate path re-routing
- Availability and integration of big data sources and historic data in the study area.
- Interoperability between Visum, Vissim, and Vistro
Rather than relying on aggregated or outdated datasets, we adopted a methodology rooted in high-quality representative-day data. Representative days for analysis were determined through cluster analysis. This analysis generated a cluster of days where the observed data matched the most frequent travel conditions (i.e., the typical cluster). This cluster represented the recurring congestion frequently experienced along the corridor. Within that cluster, a single representative day was identified for analysis.
We used big data sources to extract travel characteristics and supplement the ground traffic counts collected on the representative day.
Future efforts may involve analyzing other identified clusters (e.g., non-recurring or incident clusters) to evaluate network resiliency. This combination of data improved the calibration and accuracy of our models, enabling us to extend our analysis with confidence to alternative designs and future-year scenarios.
Layering Big Data with PTV Tools
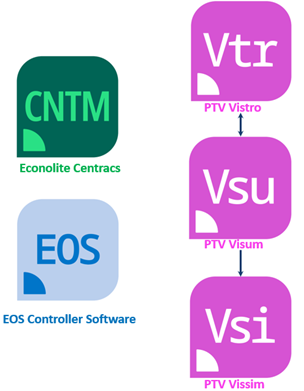
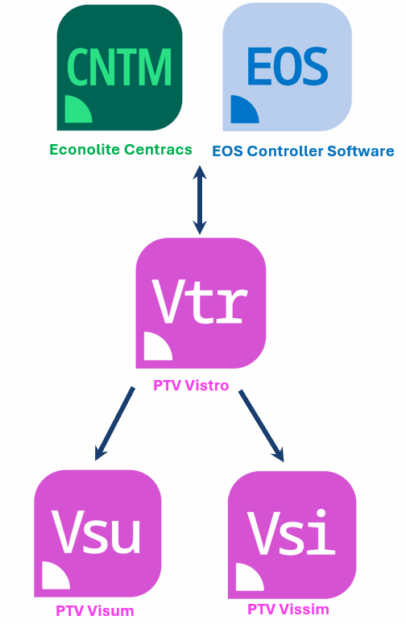
We built the project around three core tools in the PTV Suite – Visum, Vissim, and Vistro – each chosen for its unique strengths. Integrating these tools with Big Data gave us a seamless pipeline from data acquisition to actionable insights.
For background, PTV Visum is a macroscopic modeling software for multi-modal transportation planning, demand forecasting, and network analysis across regions or cities; PTV Vissim is a microscopic simulation software that models individual vehicle and pedestrian behavior; PTV Vistro is a software for intersection analysis, signal optimization, and traffic impact assessments – ideal for quick scenario testing and operational planning.
The Big Data Sources We Used
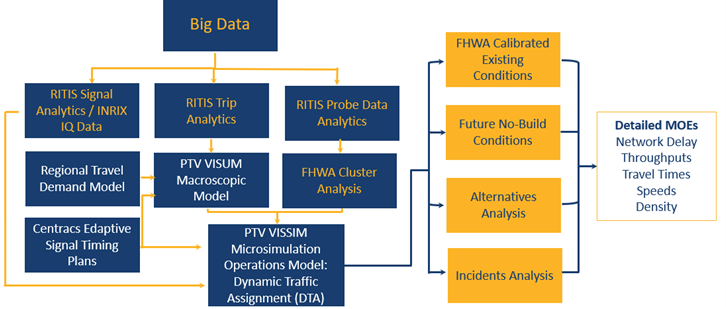
RITIS Signal Analytics: This helped us fine-tune intersection delays and understand progression effects.
RITIS Trip Analytics: Provided detailed vehicle origin-destination data, ideal for seeding and calibrating trip matrices.
RITIS Probe Data Analytics: Supplied travel time and speed data that aligned with the 2019 update to FHWA’s Traffic Analysis Toolbox, Volume III guidelines for use in model calibration.
Econolite Centracs Edaptive Signal Timings: Crucially, we had access to historical adaptive signal patterns recorded on the project’s representative days. A significant portion of the study area is running on Centracs Edaptive Signal Timings which can change day-to-day depending on travel conditions. Accessibility to this historic data on the exact representative days meant no guesswork based on the generic base timing plans.
Visum: The Macroscopic Foundation
We began our modeling work with Visum, which we used to develop traffic demand and assign flows across the region. We imported traffic analysis zones directly into Trip Analytics to create our initial trip tables. Through an origin-destination matrix estimation (ODME) procedure within Visum called TFlowFuzzy, we iteratively refined those tables until the assigned volumes closely aligned with observed traffic counts.
This allowed us to “grow” the calibrated model into a future-year baseline – in this case, 2050 – using regional growth forecasts, historic freeway trends, and known traffic impact studies. Visum gave us the agility to test future design alternatives long before they became reality.
Its interoperability with Vistro was also a major advantage. We could quickly transfer volumes and geometries into Vistro for level of service (LOS) analysis, optimize signal plans, and sync those changes back into Visum – all with minimal friction.
Vissim: Precision with Dynamic Traffic Assignment
For more detailed modeling, particularly of interchange operations and route choice, we turned to Vissim configured with Dynamic Traffic Assignment (DTA).
Unlike static routing, DTA allowed us to dynamically assign trips based on real-world conditions. This was essential for understanding how traffic would shift under different design scenarios. DTA is also essential for accurately modeling potential future incidents and understanding how traffic would shift under various lane closure conditions.
We imported calibrated subarea and future trip tables from Visum into Vissim to ensure consistency between the macroscopic and microscopic models.
By pairing big data sources with collected traffic counts, we developed a calibrated model that closely represented the actual speeds, traffic volumes, and signal timings on the representative day. We no longer had to cobble together “Frankenstein models” from unrelated days or months; we built a model that truly reflected real-world conditions.
Future Appliations
Because we built this model on a foundation of robust data and dynamic modeling, it’s set up for a wide range of future applications:
Incident Management and Signal Timing Plans
Cranberry Township already uses a traffic management center supported by predictive tools developed by Carnegie Mellon University to activate incident timing plans in the event of an incident. Since the new Vissim model encompasses parallel routes and uses DTA, it is capable of simulating and testing incident-based signal plans as well as developing new incident timing plans based on more specific incident types in conjunction with signal optimization in Vistro. Accessibility to signal timing, speed, incident, and volume data allows us to validate and optimize multiple response scenarios.
Econolite EOS Integration
With the EOS module, we can create a digital twin of the signal controller that communicates directly with PTV tools. This opens the door for a fully automated feedback loop: optimize timings in Vistro, test them in Vissim, and push them directly to the field – all within the same ecosystem.
Conclusion
By integrating Big Data with the PTV Suite, we’ve built a model that evolves with infrastructure needs, traffic behavior, and operational demands. We’re no longer limited to retrospective analysis. Instead, we can simulate, optimize, and implement solutions proactively.
We encourage the use of Big Data not as an add-on, but as a core component of modern mobility modeling. It sharpens the insights and accuracy and ultimately empowers smarter infrastructure decisions.
For any type of analysis within the PTV Suite, incorporating Big Data into the modeling flow can simplify model calibration, increase confidence in results, and position models to be adaptable for multiple analysis scenarios.

Road Infrastructure Planning & Management
A guide to road infrastructure planning that ensures efficient and safe transportation
A Guide to Road Infrastructure Planning & Management
How to ensure transportation systems are efficient, safe, and future-proof
Related Posts


