Closing roadways within a transportation network is a main cause of non-recurring congestion due to diminished capacity. Connected and Automated Vehicles (CAVs) present an opportunity to enhance operations, leading to positive environmental outcomes. A case study on an urban expressway in Buffalo, New York, has precisely investigated these potentials. We talked to Soheil Sajjadi, PhD, P.E. (Arcadis), one of the study’s authors who initiated the idea, about the simulation approach and results.
Firstly, could you explain how you initially got involved in this project and what motivated your team to pursue it?
Soheil: Absolutely. So, the project stemmed from our desire to bridge transportation engineering with environmental considerations to find new business development opportunities. At Arcadis, we strongly focus on sustainability, and with the global concern over climate change, it felt like a natural progression for us. We wanted to showcase the software’s capabilities in calculating emissions and explore potential interdisciplinary projects that intersect transportation and environmental engineering.
Could you elaborate on the project setup?

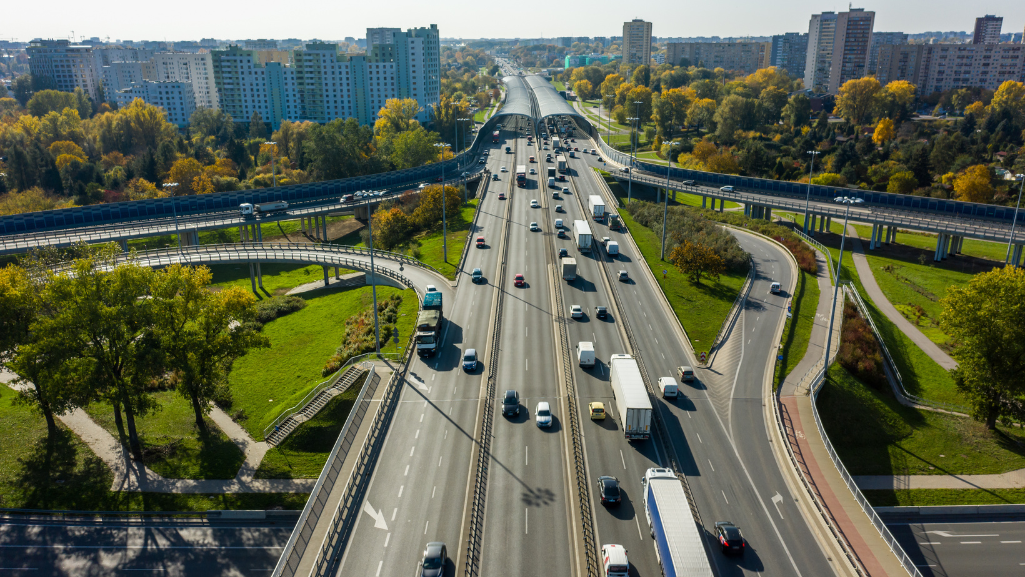
Soheil: Certainly. We used PTV Vissim to simulate different roadway closure scenarios. For this, we modelled a section of the NY 400 expressway in Buffalo, New York, with two lanes in each direction. The study area covered five miles in length. We had an upstream area, an advanced warning area, an activity area, and a downstream area. (Figure 1)
We gathered data from sources like traffic counts and speed and vehicle compositions from the New York State DOT. We used the Motor Vehicle Emission Simulator (MOVES) Matrix to estimate project-level energy consumption under various scenarios.
The scenarios involved alterations in traffic demand, CAVs penetration rates (0, 20, 40, 60, 80, and 100%) and changes in driving behavior using the default values for cautious, normal, and aggressive. Greenhouse gas reductions were also calculated for different proportions of Electric Vehicles (E.V.s) in the vehicle fleet.
Within the calibrated model, we ran simulations for different scenarios, ensuring robustness through multiple iterations. We had 48 scenarios with varying demand parameters, the CAV market transition, and the driving behavior. We ran each of the scenarios ten times. We aimed to assess the impact of emissions under different conditions accurately. (Figure 2)


The results you presented are quite fascinating, particularly the insights regarding driver behavior and the introduction of electric vehicles. Can you explain how these factors influenced the emissions outcomes?
Soheil: Absolutely. Compared to the base scenario with no CAVs in the network, the findings indicated that the sharpest reduction in energy consumed was obtained for scenarios featuring high traffic flow with increasing saturation of CAVs and vehicles driving normally. As we introduced more CAVs, emissions decreased. However, we didn’t observe significant benefits for cautious or aggressive scenarios, which aligned with expectations. Driving too slowly with frequent stop-and-goes or too aggressively tends to increase emissions. (Figure 3).
Regarding the impact of electrification, we observed that, on average, emissions in each scenario decreased by the same amount as the E.V.s’ target proportions. As shown on the second slide, cautious and aggressive driving behaviors don’t differ much between cautious and aggressive when we reach higher market penetration rates. The normal driving scenario demonstrates better emissions outcomes again.
Nevertheless, we also faced challenges, particularly in modelling high market penetration rates of electric vehicles. This necessitated careful fine-tuning and adjustments to our models to capture the impact on emissions accurately (Figure 4).

Could you share any key takeaways or insights from your project that you believe could inform future research or policies?
Soheil: Absolutely. One key takeaway is the importance of considering technological advancements, such as electric vehicles, and human behavior in emissions modeling. Furthermore, our project underscores the value of interdisciplinary collaboration between transportation and environmental professionals in addressing sustainability challenges.
This is teamwork at Arcadis, which started as the continuation of Georges Bou Saab PhD (currently at Texas A&M Transportation Institute) dissertation with help from Nelida Hererra PhD (Arcadis), Luis Alvergue PhD (currently at Atkins), and Amin Asgharzadeh Ph.D. (currently at American Bureau of Shipping).
Many thanks for your consideration and time. Is there anything you would like to add at the end?
In Figures 3 and 4, there is a mistake in the colours not being constant between the two figures. I hope that it does not confuse the audience. I hope we can fix this. I can blame it on Amin, who generated them, and we never figured out his script. (lol)
It is a pleasure for all of us that this work is being highlighted. The main purpose was to scientifically address our planet’s issues, such as climate change and global warming.
Related Products
Related Posts


